
Has purchasing power gone up or down?
From the beginning of 2022, the sharp rise in prices linked to the energy crisis led STATEC to focus and refine its analyses of changes in purchasing power. The results of these analyses and the simulations undertaken have provided a quantified basis for discussion in negotiations between the Government and the social partners.
The latest update (NDC 1-2023) of the assessment of gains and losses in household purchasing power included the business tax credit (crédit d'impôt conjoncture - CIC) for 2023, in addition to the other measures decided on previously. The analysis shows that for all income quintiles, purchasing power has increased on average compared with 2019, the last year before the succession of crises (COVID, supply chains, war in Ukraine).
Gains in household purchasing power in 2023 compared with 2019
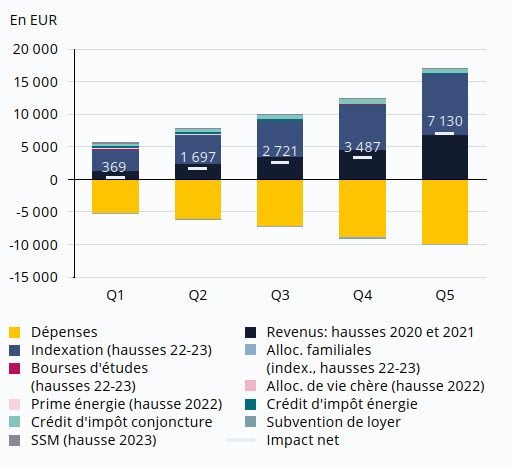
Income quintiles reflect the standard of living of households. The Q1 corresponds to the lowest 20% of households, while the Q5 represents the highest 20%.
The methodology for these assessments, based on consumer prices and STATEC survey data and administrative sources, has been detailed in the successive publications listed at the bottom of the page.
Real per capita disposable income is another measure of purchasing power. Disposable income corresponds to total household income (wages, pensions, social benefits, dividends or rents received, etc.) less social security contributions and taxes paid. By deflating this disposable income by consumer prices, we find real disposable income, which has risen by 35% since 1995.
Sources: EBM (2019), EU-SILC (2020), IGSS, STATEC calculations
Gradual rise in real disposable income per capita
Sources: Eurostat, STATEC, European Commission
Disposable income can be broken down to gain a better understanding of the origin of income increases. In particular, the automatic indexation of wages and pensions is certainly the main reason for the rise in nominal disposable income, but it only compensates for the rise in the cost of living. It should also be noted that the cold increase in taxes and social security contributions (linked to the failure to adjust tax rates) is substantially lower than the other increases in income (autonomous rise in wages, rise in social transfers including tax credits, or in capital income). Average purchasing power per person has thus increased by almost €2,000 between 2019 and 2023.
Increase in real per capita disposable income between 2019 and 2023
A comparison with neighbouring countries can be made using a similar concept, that of real wages. This shows that, by 2024 (forecast), only real wages in Luxembourg will have increased significantly. This is due in particular to more contained inflation and more dynamic nominal wage trends than in neighbouring countries.
Comparison of average real wage costs with neighbouring countries
Sources: Eurostat, STATEC, European Commission
Inflation compared to neighbouring countries
Sources: Eurostat, STATEC, European Commission
Comparison of nominal average wage costs with neighbouring countries
Sources: Eurostat, STATEC, European Commission
Contact
Bureau de presse/Press office | +352 247-88 455| press@statec.etat.lu
Reproduction in whole or in part of this press release is authorized provided the source is acknowledged.
Last update