
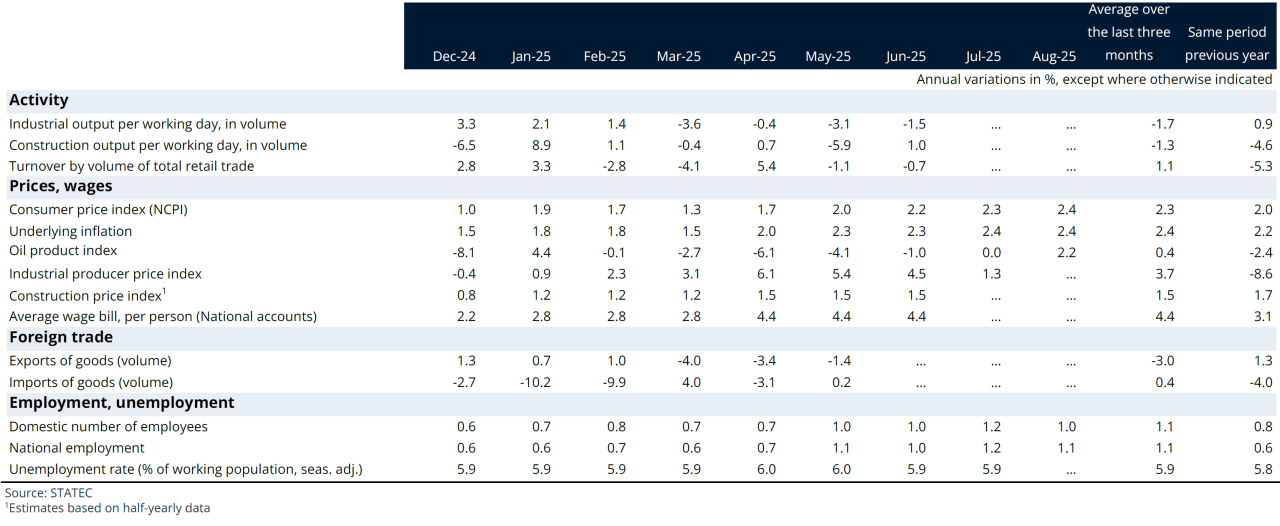
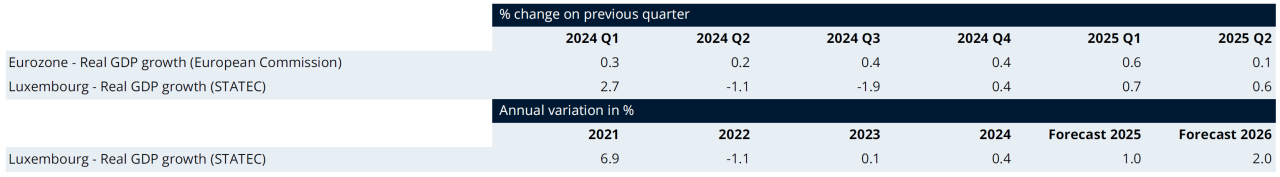
Conjoncture Flash September 2025: A moderate recovery
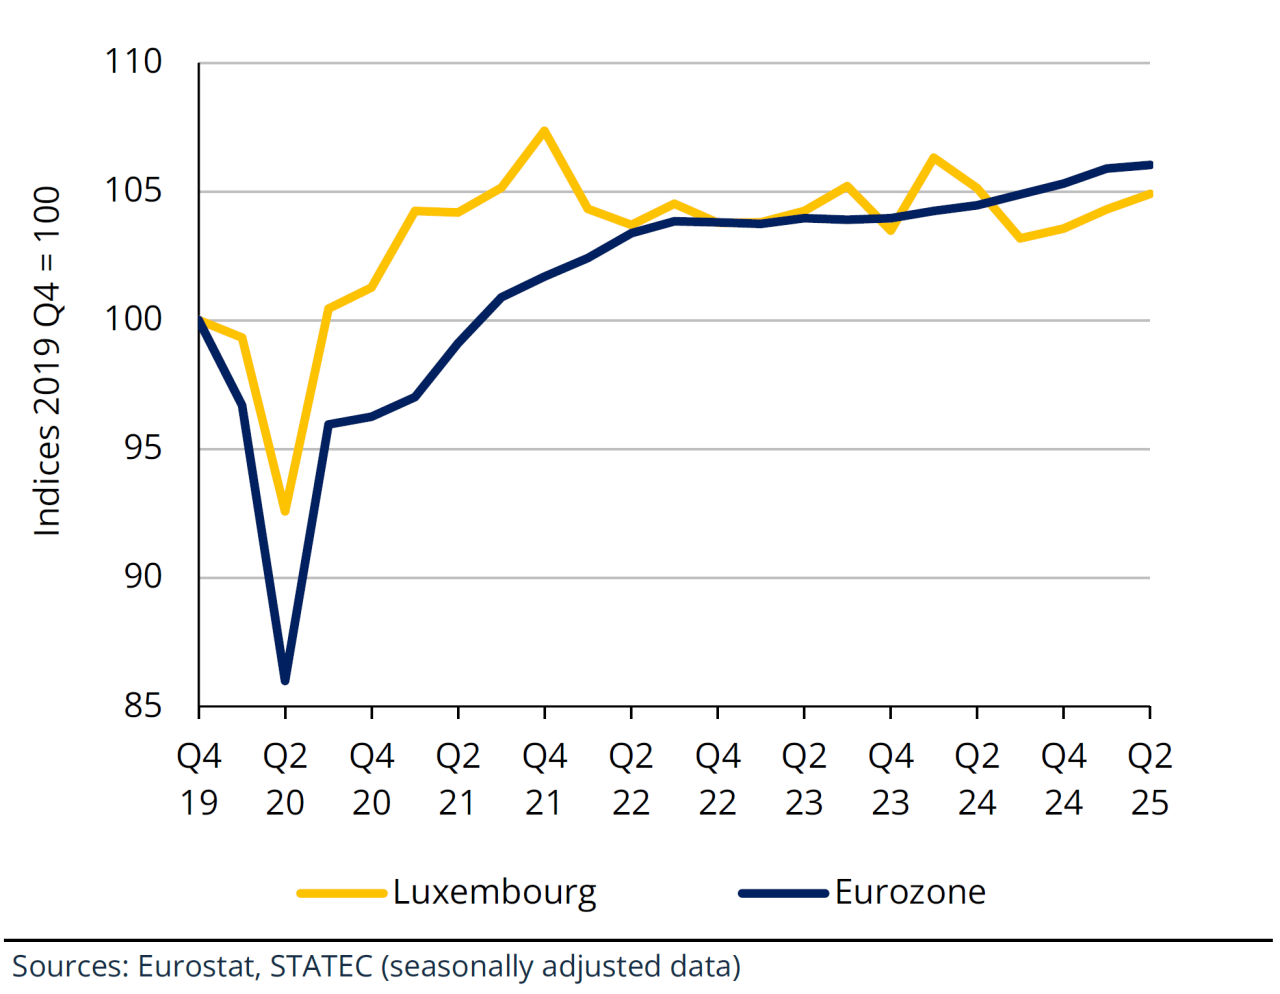
Luxembourg's GDP rose in the 2nd quarter of 2025, continuing the positive trend of the previous two quarters. However, this upturn in activity follows three years of quasi stagnation.
On 5 September, STATEC published the results of the quarterly national accounts for the 2nd quarter of 2025 as well as revised annual data for the years 2023 and 2024.[1] Real GDP rose by 0.6% over the quarter in Q2, indicating that the recovery in activity already seen in the previous two quarters is continuing.[2]
After falling back in the first quarter, household consumption rose only slightly in the second, with increased spending on health services, restaurants and food products. On the other hand, households consumed fewer property management services and goods and services relating to personal vehicles than in the 1st quarter. Public consumption remained buoyant, growing at a pace in line with previous quarters. There was a fall in investment spending (gross fixed capital formation), particularly in non-residential construction and aircraft and satellites (other transport equipment, metal products and machinery, on the other hand, saw higher investment volumes than in the 1st quarter). Exports stagnated in Q2, under the combined effect of an increase in non-financial services and a decline in goods and financial services.
Growth in value added in the 2nd quarter (+0.3% over the quarter) was mainly driven by information and communication services (+4.9%) and by predominantly non-market activities (public administration, education and health, +0.9%). Industry, real estate and business services also made a significant positive contribution to overall growth. On the other hand, construction and services in the "Trade, transport, accommodation and food" sector had a negative impact in Q2 (mainly due to the transport component).
[1] For 2024, this is an initial estimate of the full annual accounts.
[2] Note that quarterly trends in real GDP have been revised as follows: +0.7% instead of -1.0% for the 1st quarter of 2025, +0.4% instead of +1.3% for the 4th quarter of 2024 and -1.9% instead of -1.2% for the 3rd quarter of 2024.
Real GDP in Luxembourg and in the eurozone
Annual data revised
On the basis of the new annual results, real GDP growth for 2023 has been revised upwards to +0.1%, compared with -0.7% previously. However, growth for 2024 has been revised downwards, to +0.4% instead of +1.0% in the previous quarterly estimates of June 2025.
In a sectoral view, the main annual revisions concern business services (where real value added was revised significantly downwards in both 2023 and 2024), information and communication services (revised upwards for 2023), and financial activities (revised upwards, especially in 2024, see below).
Household consumption is now higher and more dynamic than before (with volume growth averaging 3.5% per annum over 2023 and 2024, compared with just 1.5% previously). Capital expenditure continued to fall in 2023 and 2024, but less sharply than in previous annual results (especially for 2024). The main revisions in terms of foreign trade concern non-financial services, which have been significantly revised downwards for both exports and imports in 2024.
These new, revised figures do not alter the fact that economic activity has been extremely sluggish over the last three years, as reflected in the marked slowdown in job creation – particularly in the market sector – over this period.
International
Real private investment in the United States
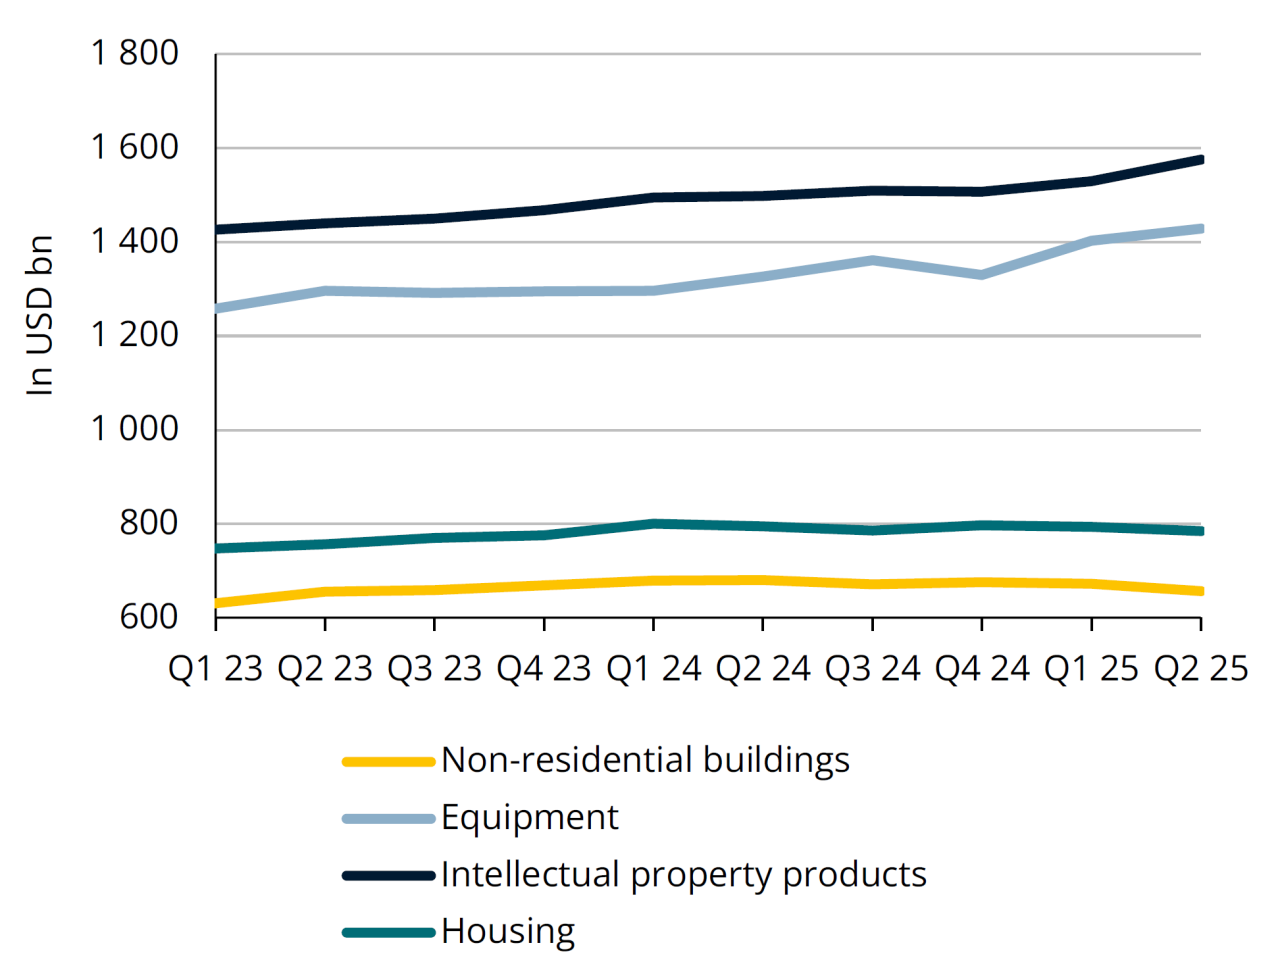
Source: Bureau of Economic Analysis (seasonally adjusted data)
United States: investment figures point to a buoyant economy
Although slowing (moderately) in the United States, activity remains on a positive trajectory. This can be seen – among other things – in investment, private investment more precisely. Abstracting from public investment makes it easier to identify links with economic determinants such as demand, activity and interest rates. US companies have continued to expand production capacity (equipment and non-residential buildings) at an annual rate of between 3% and 5% in recent quarters (i.e. much faster than economic activity, which is only expanding by around 2% year-on-year).
Intellectual property products are the largest component of private investment, accounting for around 6% of GDP. They would mostly be investments in artificial intelligence products by major US technology players. Non-residential construction and housing have lost momentum in recent quarters, no doubt as a result of past interest rate rises. In this regard, the recent cut announced by the FED is positive news, but potential effects will only gradually become apparent.
Financial environment
Nominal effective exchange rate
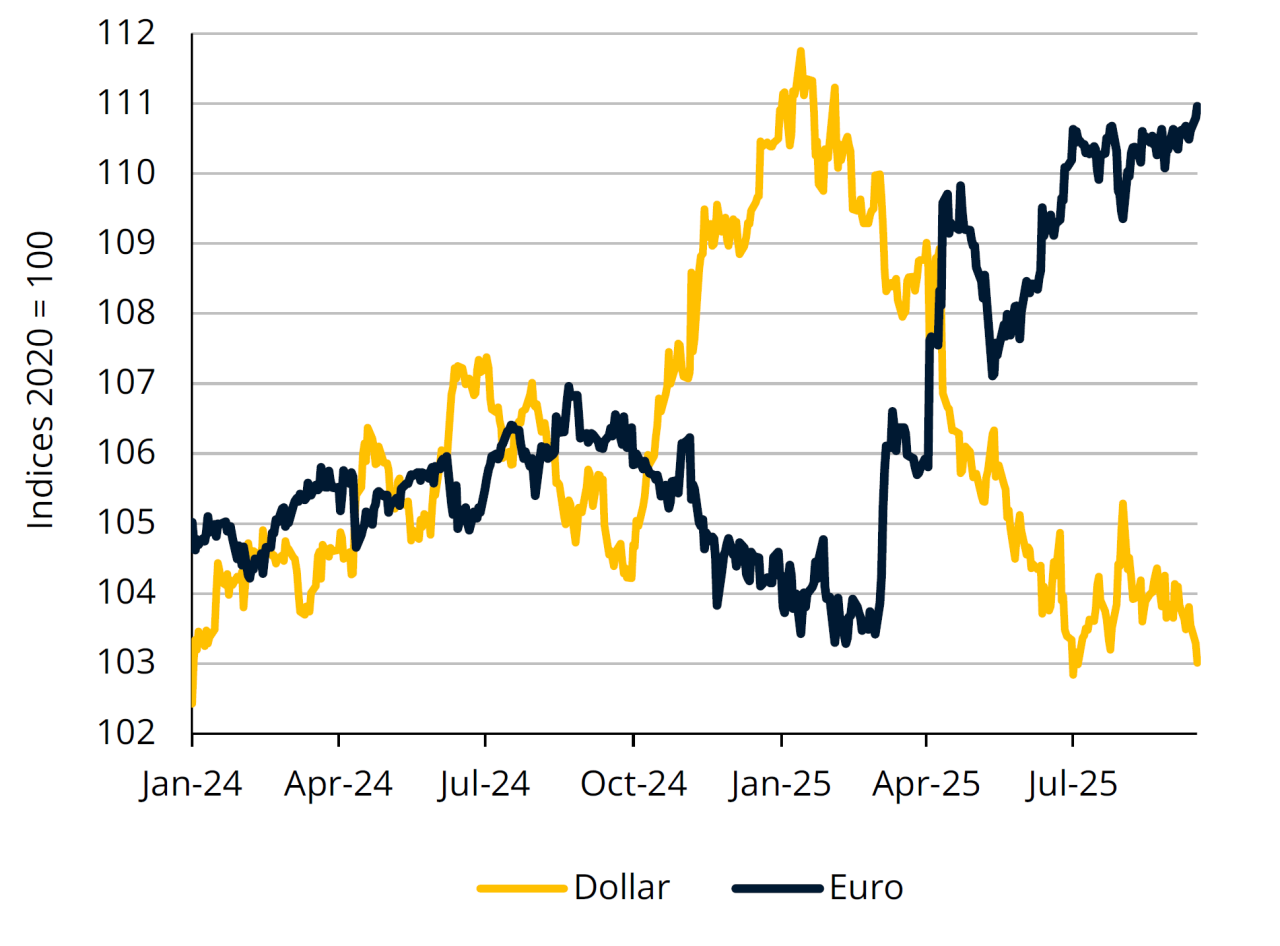
Sources: BIS
Euro continues to strengthen
The euro has gained significantly since the start of the year: +13% against the US dollar, +10% against the yuan, +7% against the yen, +5% against the pound sterling. The single European currency is at its highest point against the dollar since September 2021.
This gain has been further accentuated by recent monetary policy decisions on both sides of the Atlantic. The FED cut its key rate by 25 basis points for the first time this year and has signalled further cuts of up to 50 basis points by the end of 2025. US inflation remains relatively high, at 2.9% in August (3.1% according to the core index), while inflation in the eurozone has reached the 2% target. After four rate cuts in the eurozone (down a total of 100 basis points), the ECB left rates unchanged for the second meeting in a row, suggesting that its rate-cutting cycle may be over. Inflation is expected to average around 2% in 2025 and to continue to slow slightly in 2026. Core inflation is expected to slow as wage pressures and rising service prices ease. The appreciation of the euro is also expected to act as a brake on price increases for certain goods. The easing of financing conditions, coupled with rising household incomes and a rebound in foreign demand, should stimulate activity in the medium term.
Financial sector
Real value added in the financial sector
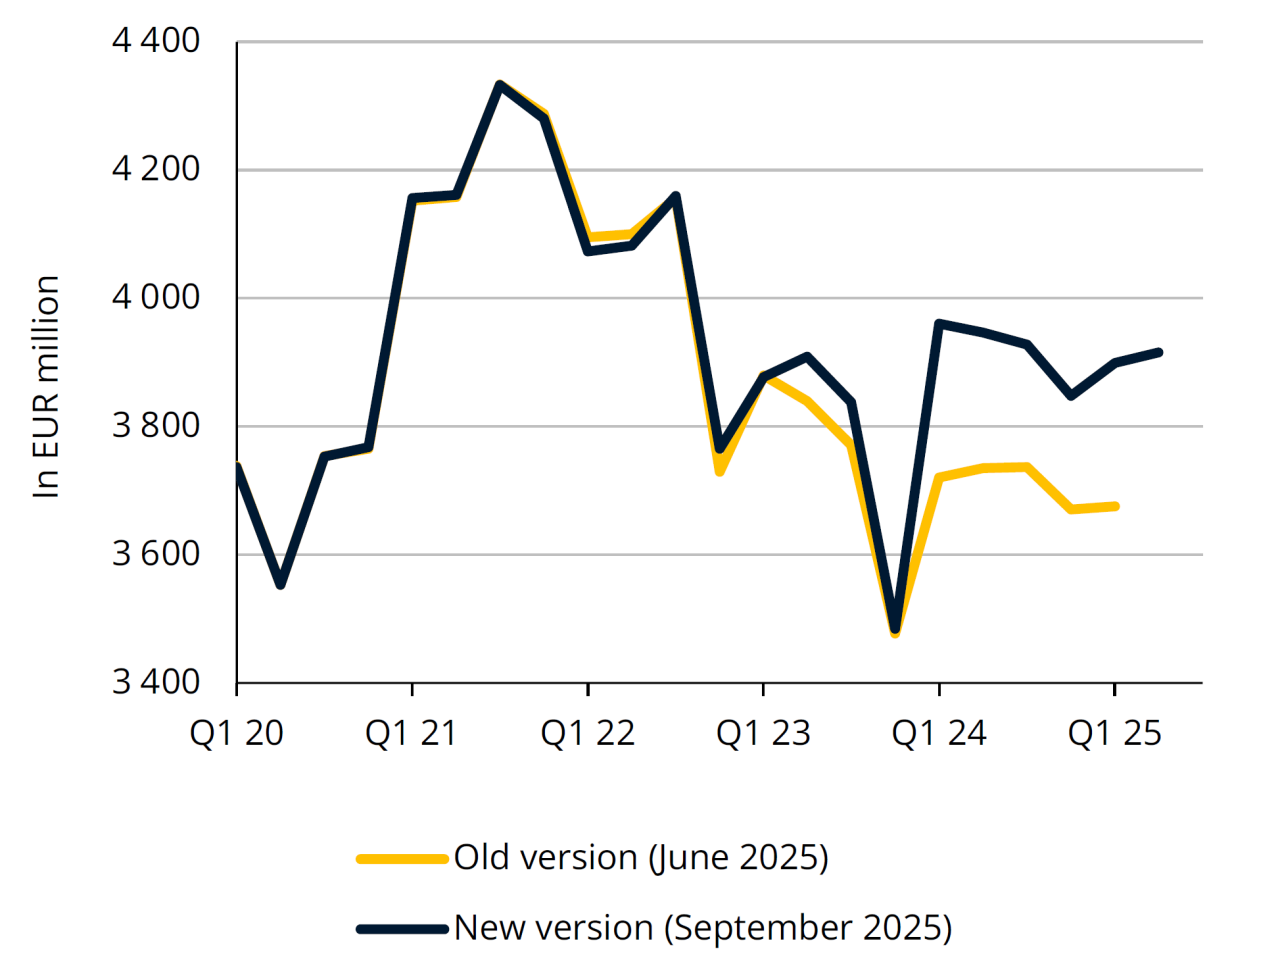
Source: STATEC (National Accounts
Added value revised significantly upwards
Estimates of gross value added (GVA) in the financial sector over the last two years were significantly revised upwards in the latest round of national accounts.
These revisions mainly concern the results of insurance companies and financial auxiliaries, as well as FISIM (financial intermediation services indirectly measured). The integration of more complete data on premiums, claims paid out and provisions has led to an upward revision of GVA for insurance activities. The integration of the annual results of financial auxiliaries and a review of price indicators led to a positive revision of real GVA. Prices for FISIM have also been revised.
Real GVA in this sector stabilised in Q2 2025, boosted by a sharp rise in premiums on unit-linked life insurance products but dragged down by falling bank interest margins and commissions.
Inflation
Coffee and cocoa prices
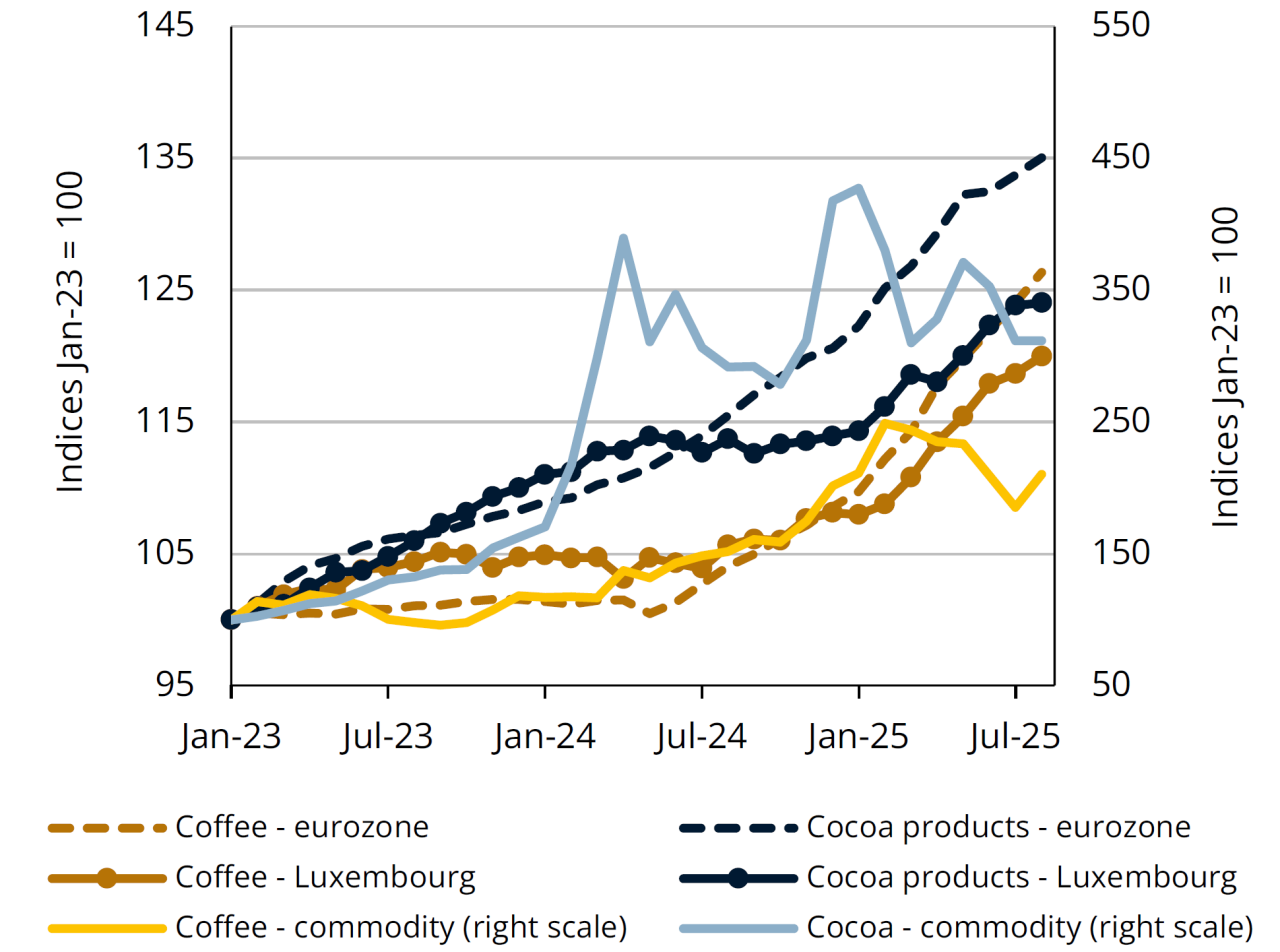
Sources: S&P GSCI, Eurostat, STATEC (seasonally adjusted data)
Coffee and cocoa have become more expensive
Due mainly to exceptional weather conditions, world coffee and cocoa prices rose sharply in 2024. They reached a peak in early 2025, marking an increase of 150% for coffee and 330% for cocoa compared with early 2023. Since then, prices have fallen for both commodities (by some 25% between January and July, a downward trend which came to a halt in August), but this has not yet been reflected in prices on the shelves.
Consumer prices for coffee and cocoa products (including chocolate and its derivatives) have accelerated in the eurozone since mid-2024 and continue to trend strongly upwards up to August, by around +20% year-on-year in the eurozone and +10% in Luxembourg. This partly explains the rise in food inflation (+3.2% year-on-year in August in the eurozone, +2.6% in Luxembourg, excluding alcohol and tobacco). These products contributed 0.9 percentage points to food inflation in August in the eurozone and 0.4 percentage points in Luxembourg.
Wages
Compensation per employee
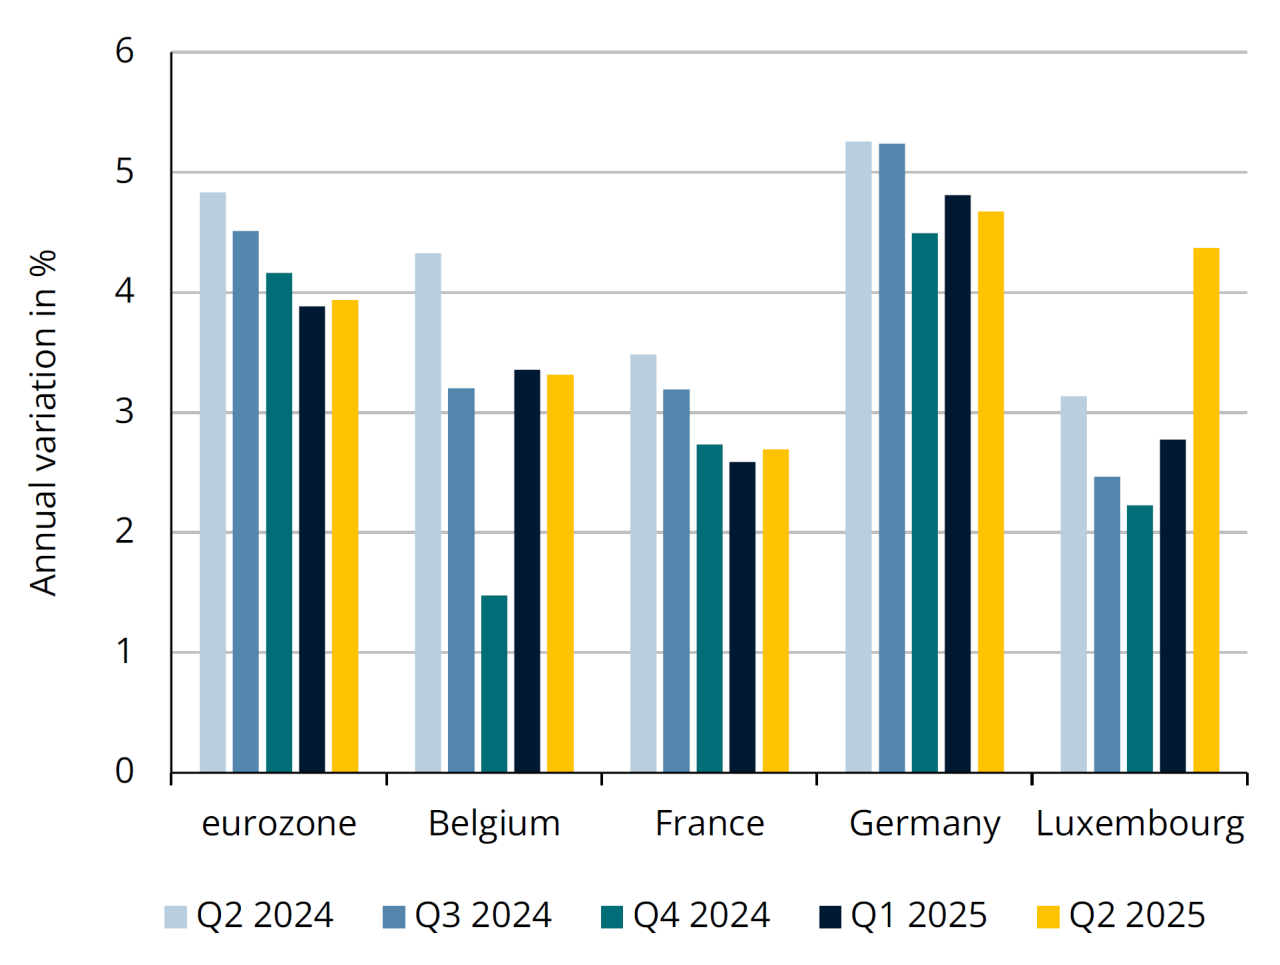
Sources: Eurostat, STATEC
Compensation per employee accelerates following the wage indexation in May
Compensation per employee rose by 4.4% year-on-year in Luxembourg in Q2 2025, marking an acceleration compared to the previous quarter (+2.8%). This was largely due to the May indexation, which contributed 1.7 percentage points to growth in average wage costs in the 2nd quarter. Other factors contributing to the rise in compensation per employee, that have already been present since the start of the year, are mainly a rebound in employers' contributions (following a reduction in 2024) and non-index-linked pay rises (including various collective bargaining and pay agreements).
Compensation per employee in the eurozone rose by 3.9% year-on-year in the 2nd quarter, at the same rate as the previous quarter. Wage growth also stabilised somewhat In France and Germany in the first half of 2025, after slowing sharply in 2024.
Forecasts for the eurozone suggest that wages will continue to slow in the 2nd half of the year, helped by the return of inflation to a level close to its target.
Labour market
Number of jobseekers registered with ADEM
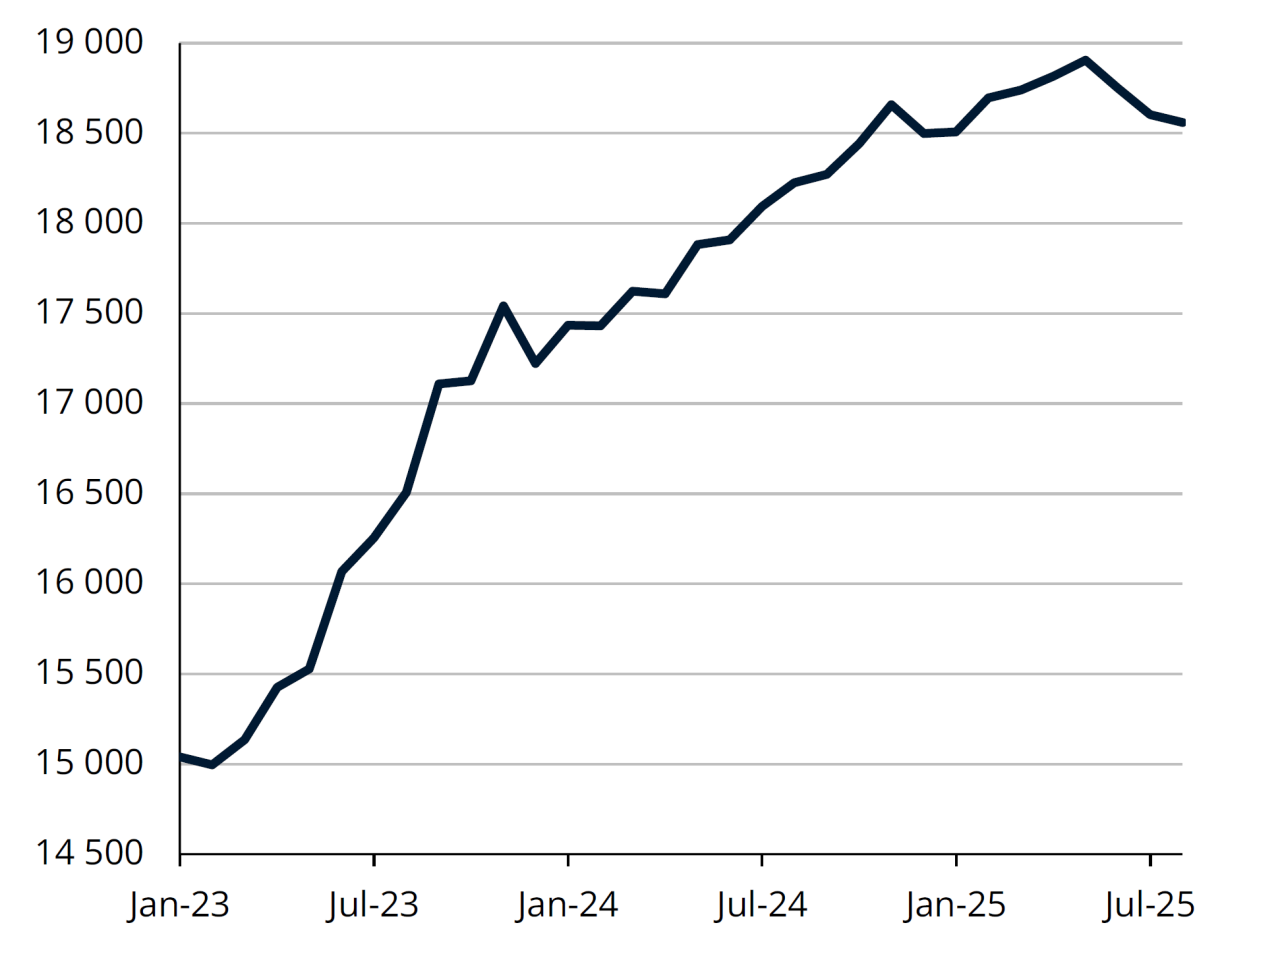
Sources: ADEM, STATEC (seasonally adjusted data)
Unemployment falls slightly
Since mid-2025, the number of jobseekers registered with ADEM (adjusted for seasonal variations) has fallen slightly, bringing the unemployment rate to 5.9% of the labour force since June, after a peak of 6.0% in April and May. Jobseekers whose numbers have fallen the most in the past three months are those registered for less than 4 months, with a background in construction or commerce and/or higher secondary level qualifications.
Employment fell slightly in August, following an exceptional rise in July. Recent employment trends show a slight improvement overall. According to the initial figures available, employment rose by 0.4% over a quarter in Q3 (two months), after +0.2% in Q1 and +0.3% in Q2 (to be compared however with the +0.8% recorded on average per quarter from 2000 to 2019). This increase in net job creation in Q3 came mainly from administrative and support services (which include temporary work). Employment in the construction sector is continuing to fall, but to an increasingly lower extent.
Energy
Greenhouse gas emissions in Luxembourg
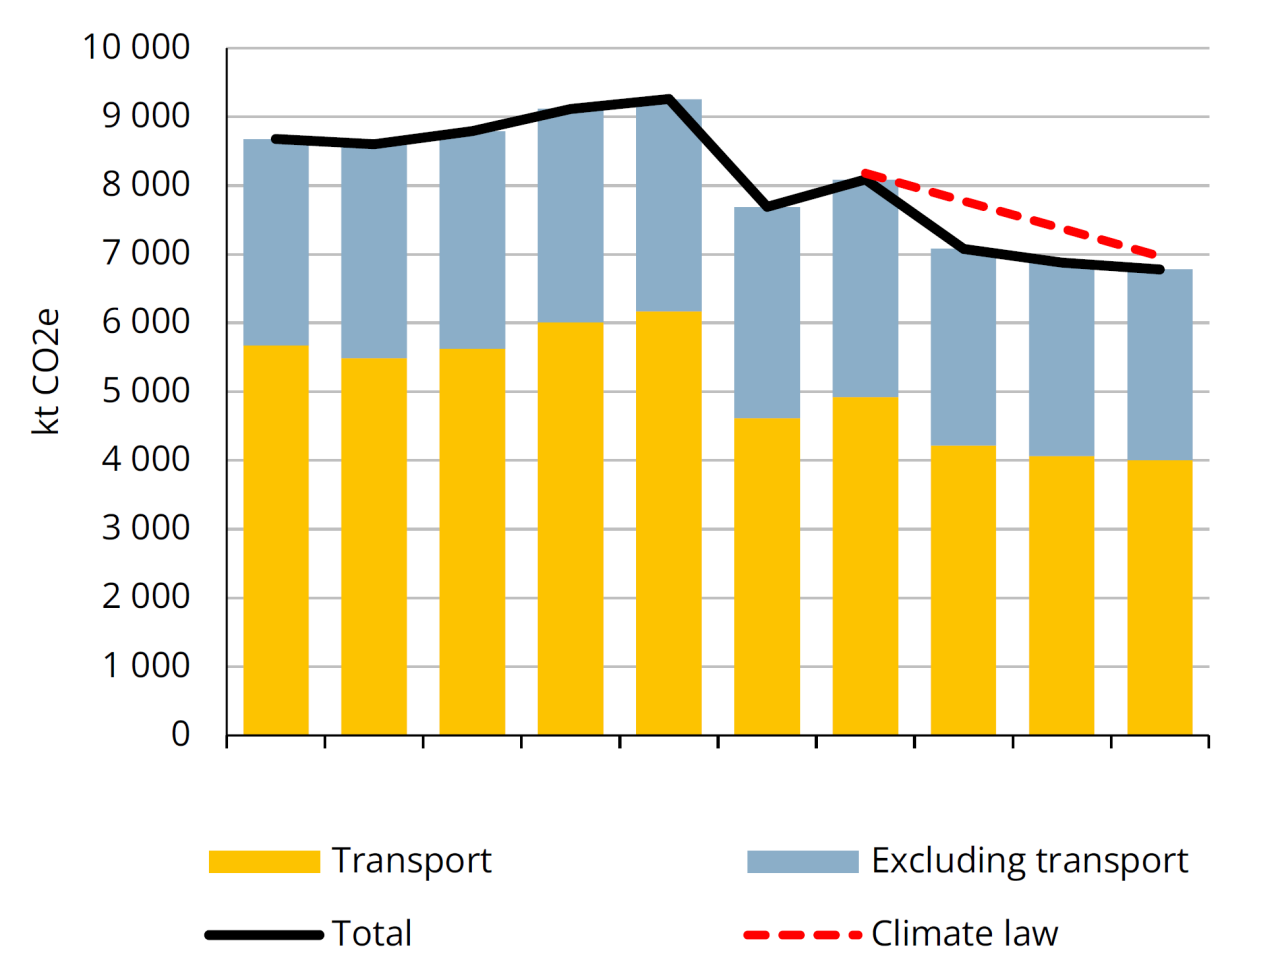
Source: Luxembourg Environment Agency (provisional inventory of greenhouse gas emissions)
Carbon emissions fall further in 2024
According to the latest provisional inventory of greenhouse gas emissions, CO₂ emissions continued to fall in 2024. At a level below 6,800 kt, Luxembourg is in compliance with the cap set by the climate law. This decline, which has been under way since 2019, is mainly due to falls in fuel sales and hence emissions, 35% lower in 2024 than in 2019. The trend is expected to continue in 2025: in the first seven months of the year, fuel sales were still down by more than 5.5% compared with the same period in 2024. This development is primarily due to the gradual increase in the carbon tax but also, and increasingly, to vehicle electrification. Electric and hybrid vehicles now account for around 23% of the total number of vehicles nationally.
Non-transport emissions are also on a downward trajectory, albeit more moderate, falling by around 10% in 2024 compared with 2019. This reduction was mainly due to a decline in the use of fossil fuels in the building sector (emissions down by 17% over the same period). By contrast, emissions from manufacturing (excluding ETS) and agriculture have remained relatively stable since 2019.
Dashboard
Indicators
Dernière modification le