
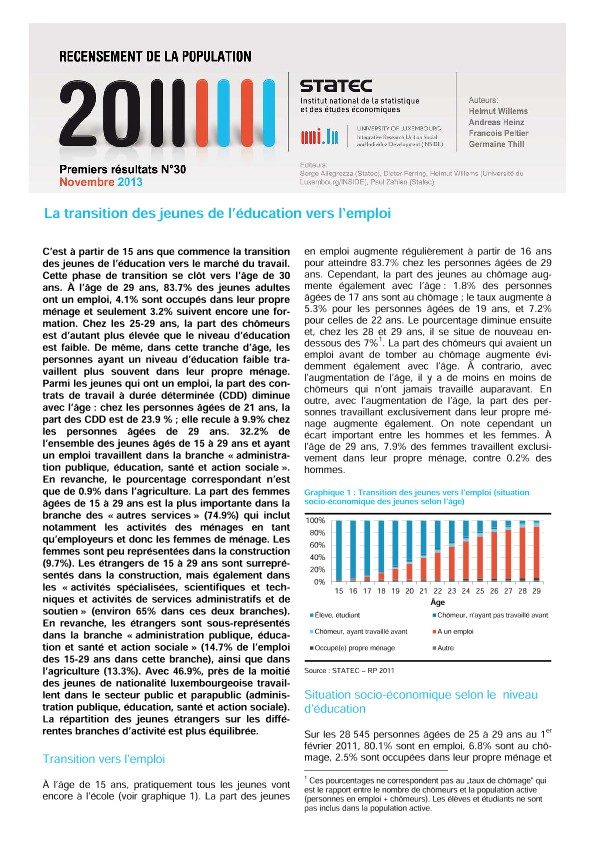
The transition of young people from education to the labor market begins at age 15. This transition phase ends at the age of 30 years. At the age of 29, 83.7 % of young adults are employed, 4.1 % work in their own households and only 3.2 % are still in education. Unsurprisingly, in 25-29 age class, the share of unemployed is much higher for people with a low education level. Similarly, in this age group, people with a low education level are working more often in their own household. Among young people who have a job, the share of fixed-term contracts (CDD) decreases with age. For young people aged 21, the share of CDD is 23.9 %. The rate falls to 9.9 % among persons aged 29. 32.2 % of all young people aged 15 to 29 years, and having a job, work in the economic branch of "public administration, education, health and social work". In contrast, the corresponding figure is only 0.9 % in agriculture. The share of the female population aged 15-29 years is important in the branch of "other services" (74.9 %), which includes in particular the activities of households as employers and hence the maids. Women are poorly represented in construction (9.7 %). Foreigners aged 15-29 are overrepresented in the construction branch, but also in the "professional, scientific, technical and administrative activities and support services" (65% in both branches). However, foreigners are underrepresented in the "public administration, education and health and social work" branch (4.7 % of the foreigner aged 15-29 in employment) and in agriculture (13.3 %). Almost half of young people (46.9 %) having the Luxembourg nationality work in the public and broader public sector (public administration, education, health and social work). The distribution of young foreigners on the economic branches is more balanced.
More data (french EXCEL files)
Other languages
Les personnes âgées
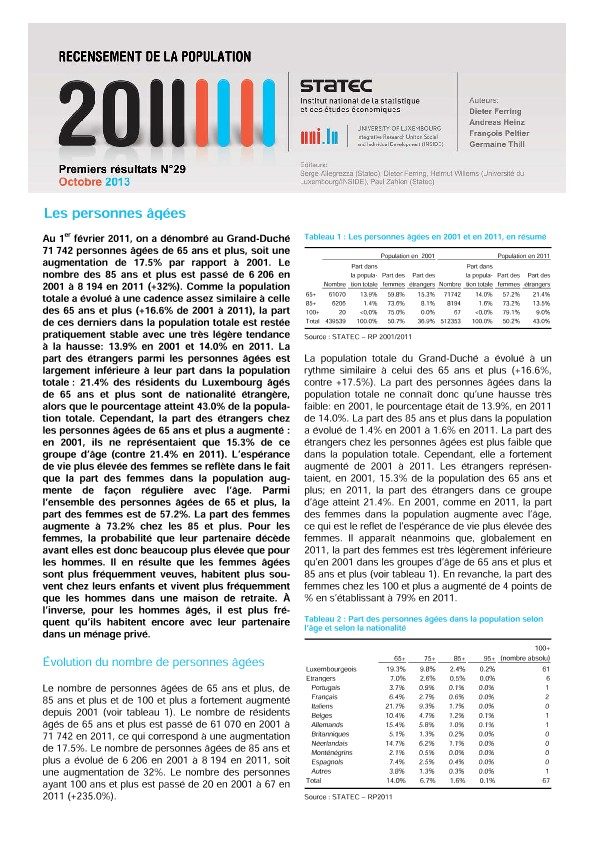
71,742 people aged 65 and over lived in the Grand Duchy at the census date, an increase of 17.5% compared to 2001. The number of those aged 85 and over rose from 6,206 in 2001 to 8,194 in 2011 (+32%). As the total population has evolved in a quite similar way (+16.6% from 2001 to 2011), the share of the elderly (65 and over) in the total population has remained fairly stable with a slight upward trend: 13.9% in 2001 and 14.0% in 2011. The share of foreigners among the elderly is much lower than their share in the total population: foreigners make up 21.4% of the population aged 65 and over living in Luxembourg, while the percentage of foreigners in the total population reached 43.0%. However, the proportion of foreigners among the elderly aged 65 and over increased: in 2001, they accounted for only 15.3% of this age group (against 21.4% in 2011). The higher life expectancy of women is reflected in the fact that the share of women in the population increases steadily with age. Among all seniors aged 65 and over, the proportion of women is 57.2%. The proportion of women increases to 73.2% among those aged 85 and over. For women, the likelihood that their partner dies is much higher than for men. As a result, older women are more often widowed, live more often with their children and live more frequently than men in a retirement home. In contrast, older males live more frequently with their partner in a private household.
More data (french EXCEL files)
Enfants, jeunes et jeunes adultes
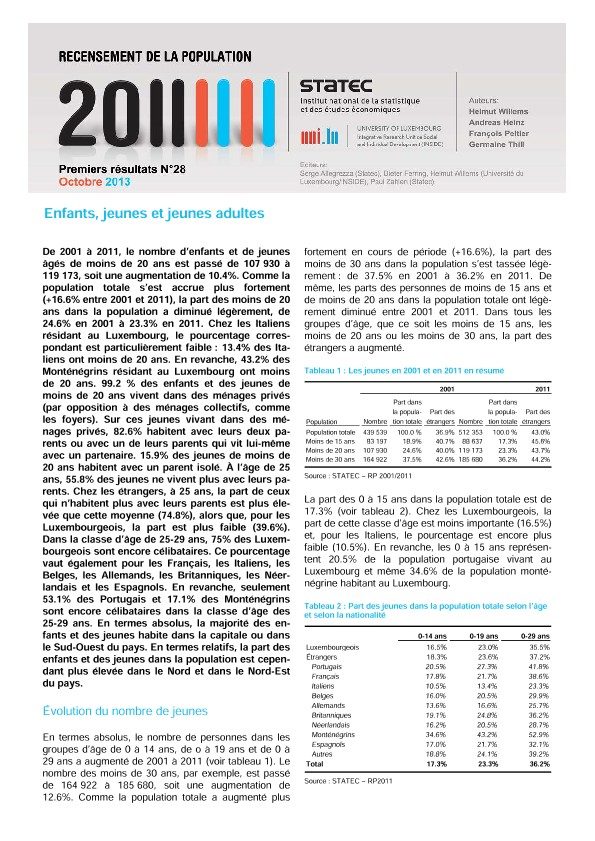
From 2001 to 2011, the number of children and young people aged under 20 years increased from 107 930 to 119 173 (+10.4%). As the total population has increased more strongly (+16.6% between 2001 and 2011), the share of the less than 20 years in the population has decreased slightly, from 24.6% in 2001 to 23.3% in 2011. For Italians living in Luxembourg, the corresponding percentage is particularly low: 13.4% of Italians are less than 20 years. In contrast, 43.2% of Montenegrins living in Luxembourg are under 20 years. 99.2% of children and young people under 20 years live in private households (as opposed to collective households such as institutions for children and young people). Of those young people living in private households, 82.6% live with both parents, or one parent who himself lives with a partner. 15.9% of those under age 20 live with a single parent. At the age of 25, 55.8% of young people in Luxembourg do not live anymore with their parents. Among foreigners, aged 25, the share of those who no longer live with their parents is higher (74.8%), while for Luxembourgers, the share is lower (39.6%). In the 25-29 years age group, 75% of Luxembourgers are still not living with a partner. This percentage also applies to the French, Italians, Belgians, Germans, British, Dutch and Spaniards. In contrast, only 53.1% of Portuguese and 17.1% of Montenegrins are still singles in the 25-29 years age group. In absolute terms, the majority of children and young live in the capital or in the south-west of the country. In relative terms, the share of children and young people in the population is however higher in the north and north-east of the country.
More data (french EXCEL files)
Les Allemands au Luxembourg
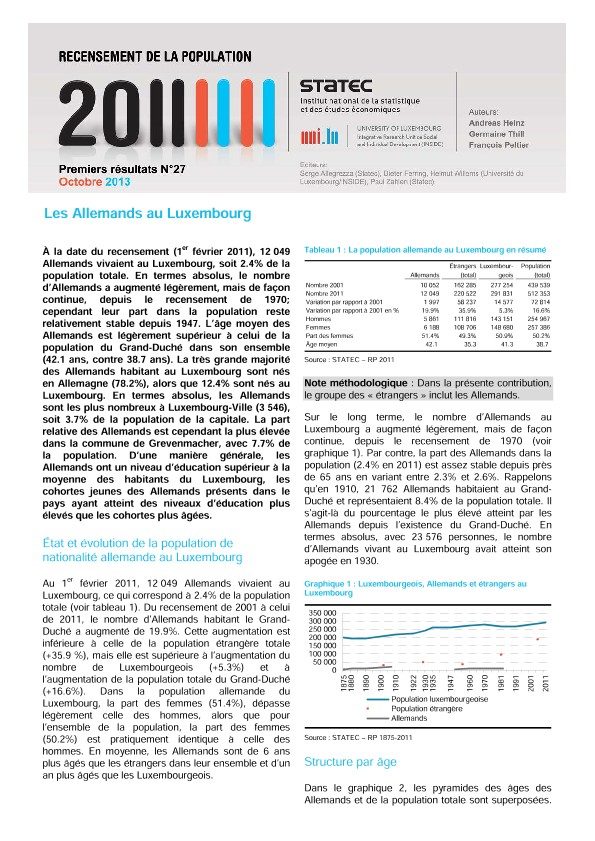
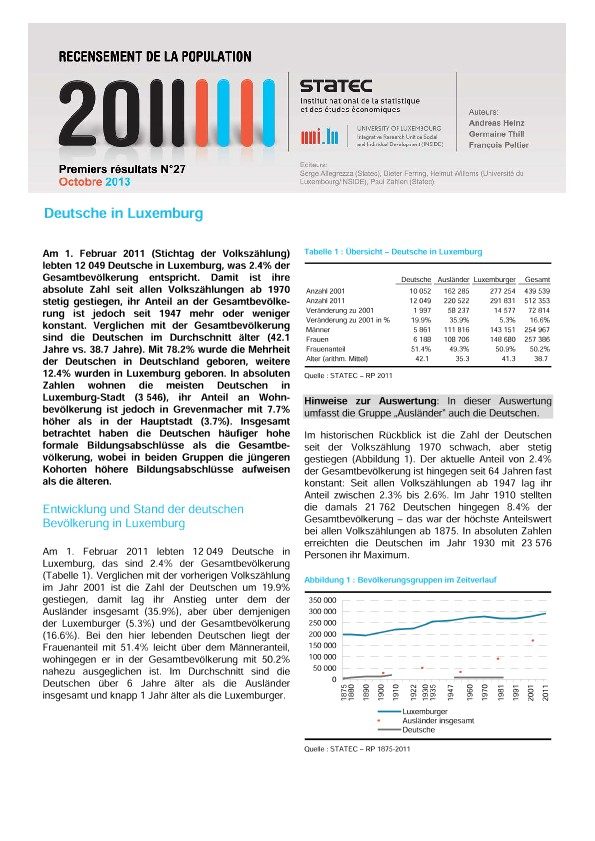
12,049 Germans lived in Luxembourg at the census date, or 2.4% of the total population. In absolute terms, the number of Germans increased slightly but steadily since the 1970 census, but their share in the population remained relatively stable since 1947. The average age of the Germans is slightly higher than the average age of the population of the Grand Duchy as a whole (42.1 years against 38.7 years). The vast majority of Germans living in Luxembourg were born in Germany (78.2%), while 12.4% were born in Luxembourg. In absolute terms, the Germans are the most numerous in Luxembourg City (3 546), or 3.7% of the population of the capital. The part of the Germans in the population is, however, the highest in the commune of Grevenmacher, with 7.7% of the population. In general, the Germans have a higher education level than Luxembourgers. The younger cohorts of the Germans in the country have reached a higher education level than the older cohorts.
More data (french EXCEL files)
Les communes de la région sud
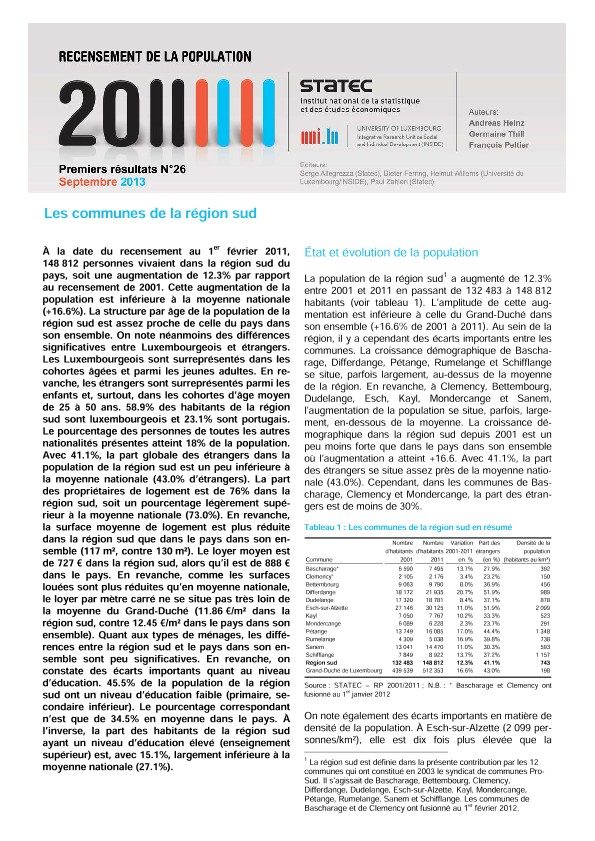
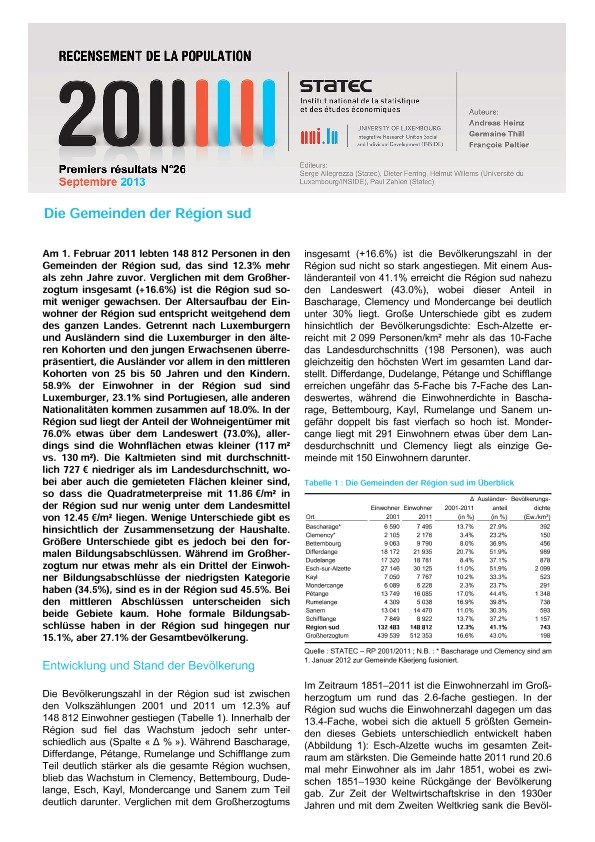
148 812 people lived in the south region of Luxembourg at the time of the census (1 February 2011). This means an increase of 12.3% compared to 2001, which is lower than the national average (+16.6 %). 58.9 % of the residents of the south region are Luxembourgers and 23.1 % are Portuguese. The percentage of the persons of all other nationalities reaches 18 % of the population. With 41.1 %, the global part of the foreigners in the population of the south region is a little lower than the national average (43.0 % of foreigners).The part of home owners is slightly higher in the south region than the national average (76.0 % against 73.0 % for the whole country). The average housing surface is lower in the south region than in the country in general (117 m ², against 130 m ²). 45.5 % of the population of the south region have a low educational level (primary, lower secondary). The corresponding percentage is only 34.5 % on average in the country. On the other hand, the part of the residents of the south region having a high educational level is, with 15.1 %, largely lower than the national average (27.1 %).
More data (french EXCEL files)
Les communes de la Nordstad
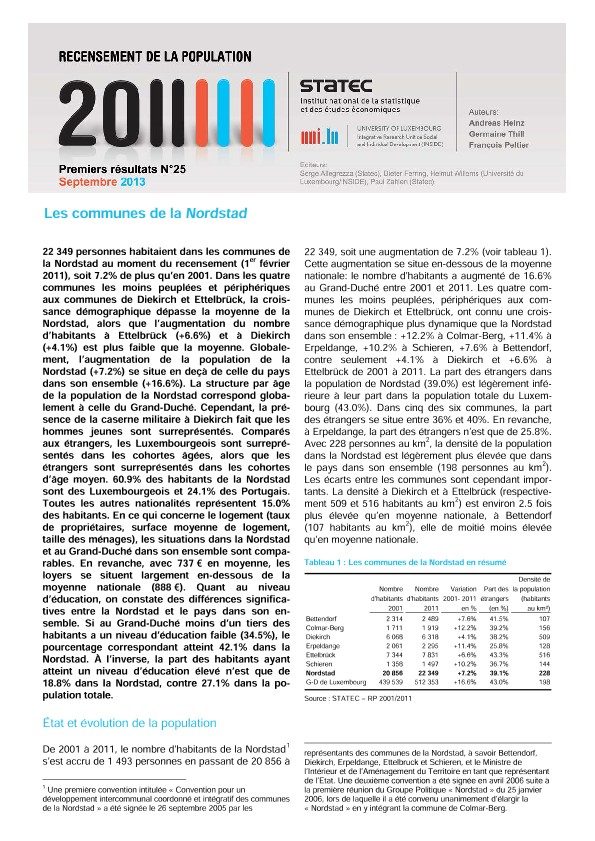
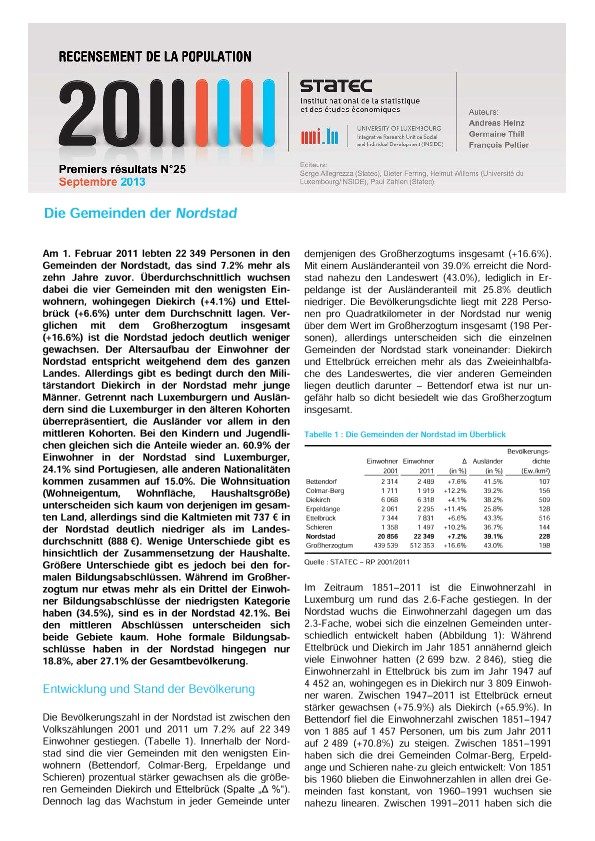
22 349 people lived in the municipalities of the Nordstad at the time of the census (1 February 2011) that is 7.2 % more than in 2001.In the four less populated and peripheral municipalities to the communes of Diekirch and Ettelbruck, the population growth exceeds the average of the Nordstad, while the increase of the number of inhabitants in Ettelbruck (6.6 %) and to Diekirch (4.1 %) is lower than the average. Globally, the increase of the population of Nordstad (7.2 %) is situated below the national average (16.6 %). 60.9 % of the inhabitants of the Nordstad are Luxembourgers and 24.1 % are Portuguese. All the other nationalities make up 15.0 % of the inhabitants. As for the educational level, significant differences exist between the Nordstad and the country in general. Less than a third of the inhabitants of the Grand-Duchy have a low educational level (34.5 %), but in the Nordstad this percentage reaches 42.1 %. On the other hand, the part of the residents having a high educational level is only 18.8 % in the Nordstad, against 27.1 % in the total population.
More data (french EXCEL files)
Les couples vivant au Luxembourg
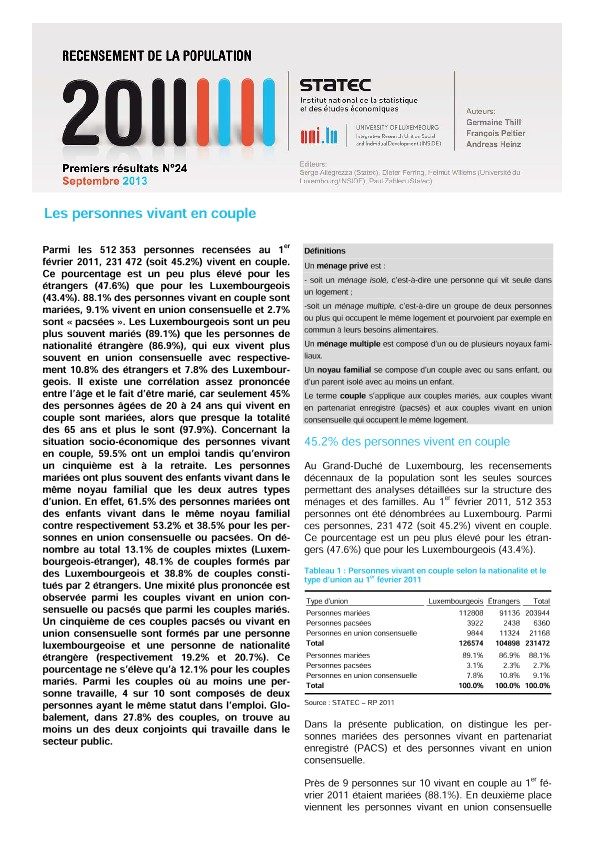
Among the 512,353 people living in Luxembourg at the time of the census (February 2011), 231,472 (45.2 %) lived in couple. This percentage is slightly higher for foreigners (47.6 %) than for Luxembourgers ( 43.4 %). 88.1 % of people living in a couple are married , 9.1 % live in a consensual union and 2.7 % in a "civil partnership " (PACS). Luxembourgers are more often married (89.1%) than those of foreign nationality (86.9 %). On the other hand, foreigners live more often in a consensual union or a “civil partnership” (10.8% of foreigners, 7.8% of Luxembourgers). There is a rather pronounced correlation between age and being married: 45% of people aged 20 to 24 years living in a couple are married, but nearly all the 65 and over are married (97.9%) . Regarding the socio- economic situation of people living in a couple, 59.5 % are employed while about one-fifth is retired. Married people are more likely to have children living in the same family nucleus than the other two types of union. In fact, 61.5 % of married people have children in the same family nucleus against respectively 53.2 % and 38.5 % of people living in a consensual union or in a “civil partnership”. 13.1 % of all couples are mixed (Luxembourger-foreigner), 48.1 % of couples are formed by two Luxembourgers, and 38.8 % of the couples are constituted by two foreigners . A more pronounced diversity is observed among cohabiting couples or PACS couples than among married couples. A fifth of these PACS or consensual union couples are formed by a Luxembourger and a person of foreign nationality (respectively 19.2 % and 20.7 %). This percentage is only 12.1 % for married couples. Among couples where at least one person is working, 4 out of 10 are composed of two people having the same status in employment. In 27.8 % of couples, there is at least one spouse who works in the public sector.
More data (french EXCEL files)
Les quartiers de la Ville de Luxembourg
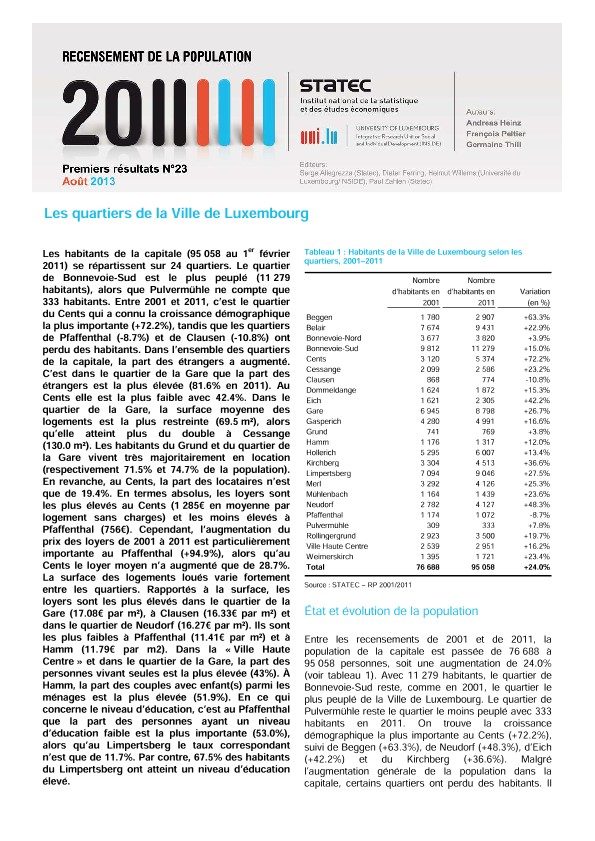
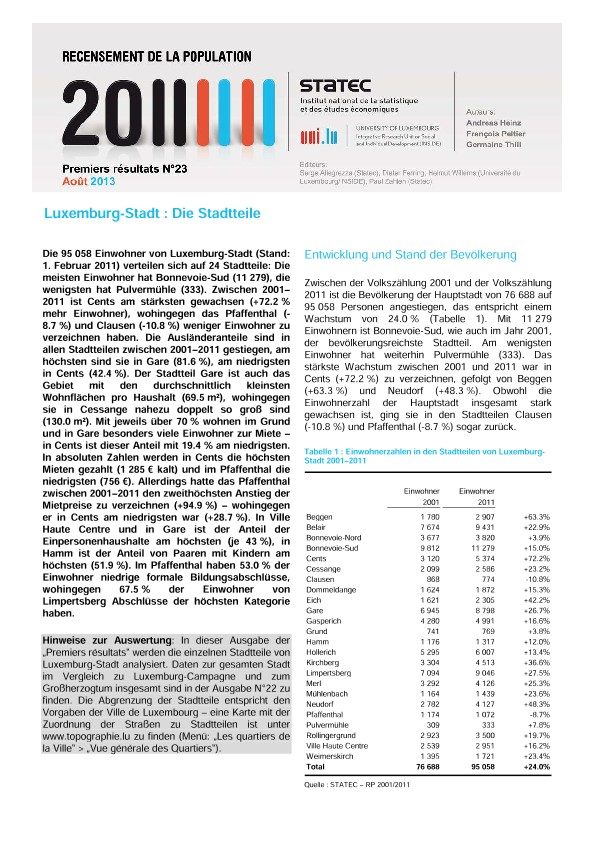
The inhabitants of the capital (95 058 on 1 February 2011) are spread over 24 districts. The district Bonnevoie-Sud is the most populous (11,279 inhabitants), while Pulvermühle has only 333 inhabitants. Between 2001 and 2011, the district of Cents has experienced the highest demographic growth (+72.2%), while Pfaffenthal (-8.7%) and Clausen (-10.8%) lost population. In all parts of the capital, the share of foreigners increased. In the station district (Gare), the proportion of foreigners is the highest (81.6% in 2011). In Cents their share is the lowest with 42.4%. In the neighborhood of the station, the average dwelling size is the smallest (69.5 sqm), that is half of the dwelling size in Cessange (130.0 sqm). Residents of Grund and the station district live overwhelmingly for rent (respectively 71.5% and 74.7% of the population). In contrast, in Cents, the share of tenants is only 19.4%.
More data (french EXCEL files)
More data (german EXCEL files)
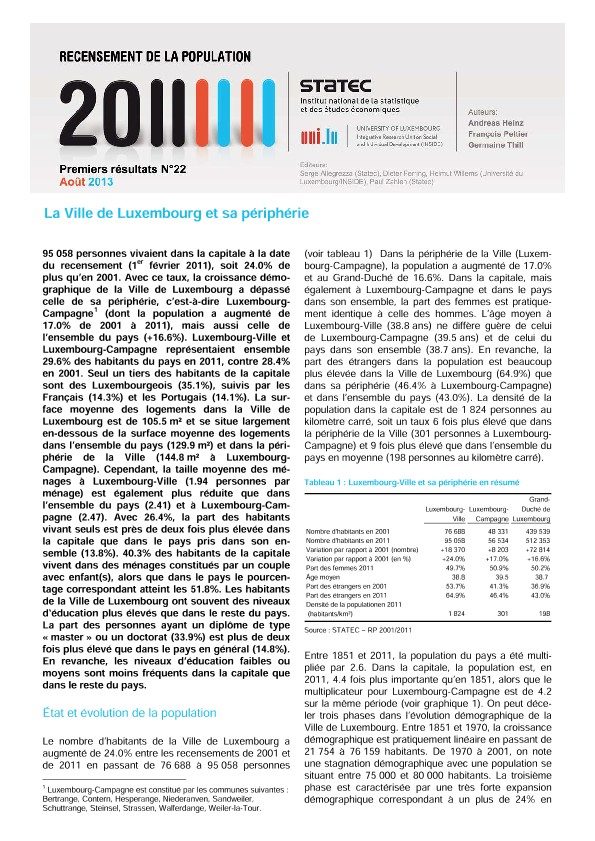
La Ville de Luxembourg et sa périphérie
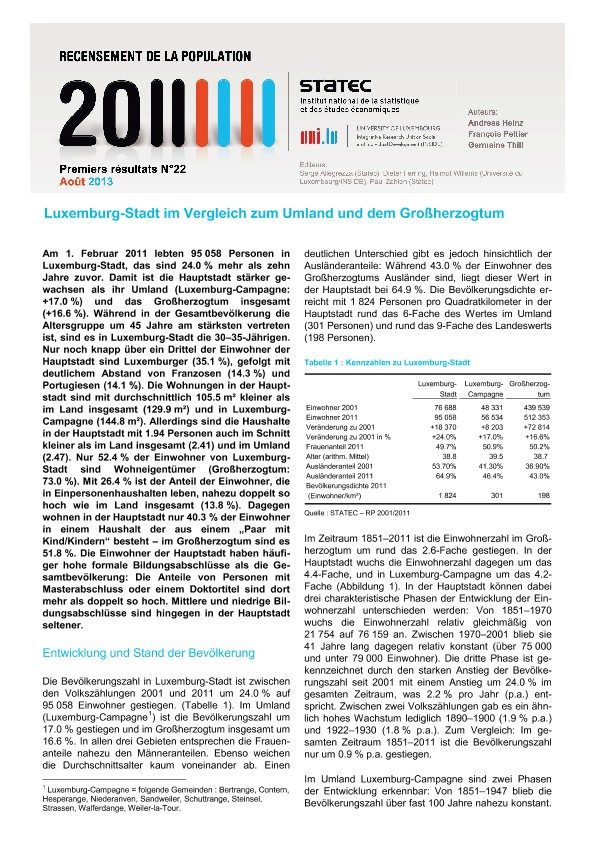
95,058 people lived in the capital at the time of the census (1 February 2011). This means an increase of 24.0% compared to 2001. The population growth of the City of Luxembourg has exceeded that of its periphery, that is to say, Luxembourg-Campagne (whose population has increased by 17.0% from 2001 to 2011), but it has also exceeded the demographic growth of the whole country (+16.6%). Luxembourg-City and its periphery accounted together for 29.6% of the inhabitants of the country in 2011, against 28.4% in 2001. Only a third of the residents of the capital are Luxembourgers (35.1%), followed by French citizens (14.3%) and the Portuguese (14.1%). The average housing surface in the City of Luxembourg is 105.5 sqm and is well below the average size of homes in the country (129.9 m²) and in the periphery of the capital (144.8 m² in Luxembourg-Campagne).
More data (french EXCEL files)
More data (german EXCEL files)
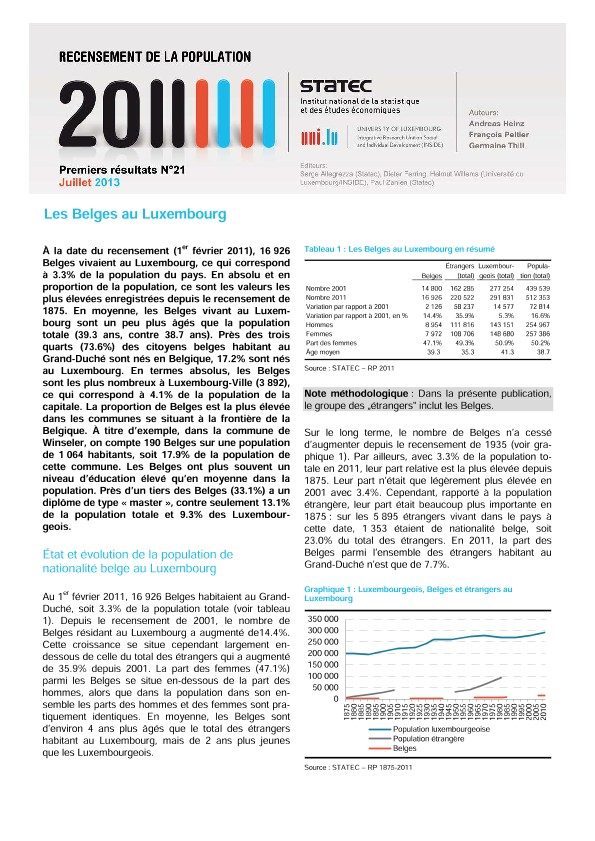
Les Belges au Luxembourg
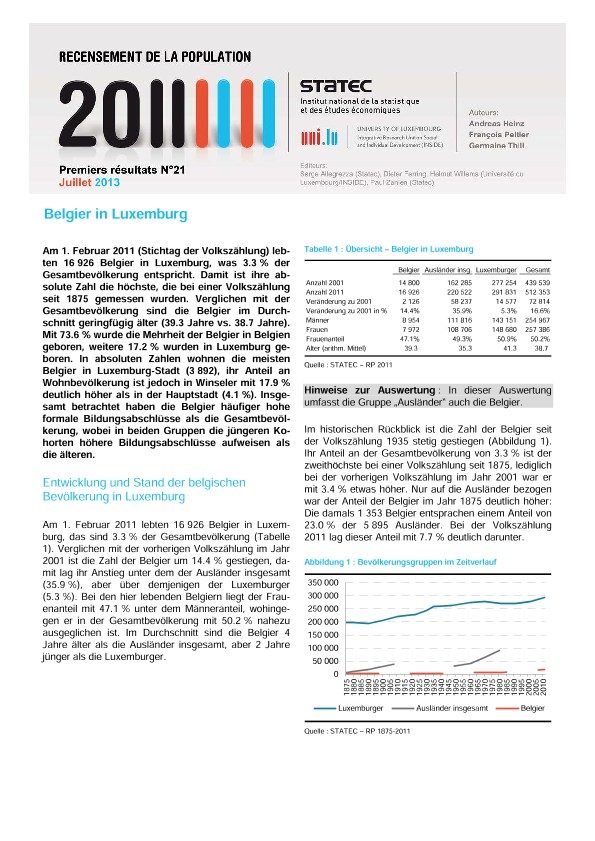
At the census date (1 February 2011), 16,926 Belgians were living in Luxembourg, which corresponds to 3.3% of the population. In absolute terms and as a percentage of the population, these values are the highest since the census of 1875. On average, Belgians living in Luxembourg are a little older than the total population (39.3 against 38.7 years). Nearly three-quarters (73.6%) of Belgian citizens living in the Grand Duchy were born in Belgium, 17.2% were born in Luxembourg. In absolute terms, the Belgians are the most numerous in Luxembourg City (3 892), which corresponds to 4.1% of the population of the capital. The proportion of Belgians is higher in the Luxembourg regions lying on the border of Belgium. For example, in the commune of Winseler, the Belgians are 190 out of a total population of 1 064 people (17.9% of the population of this commune). On average, the education level of Belgians is higher than that of the total population. Nearly a third of Belgians (33.1%) had a "master" diploma, compared to only 13.1% of the total population and 9.3% of Luxembourgers.
More data (french EXCEL files)
More data (german EXCEL files)
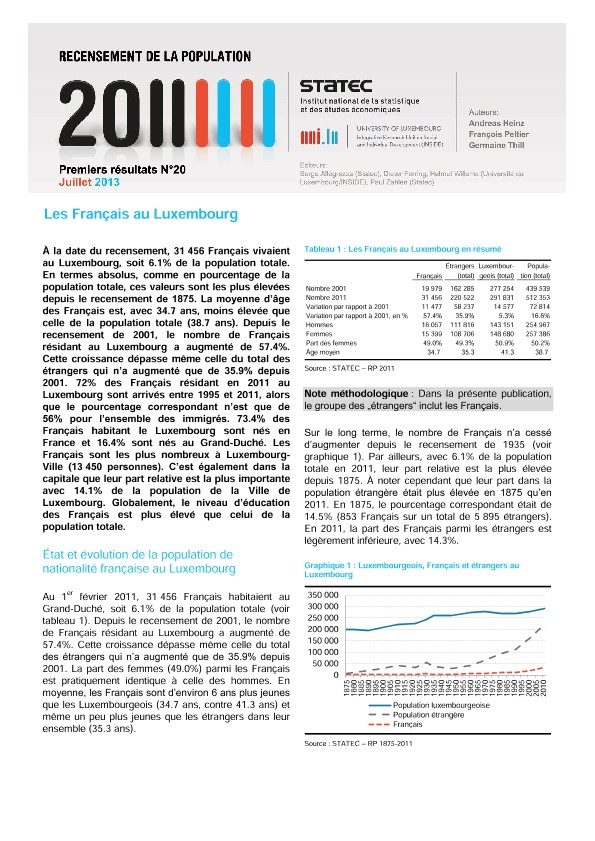
Les Français au Luxembourg
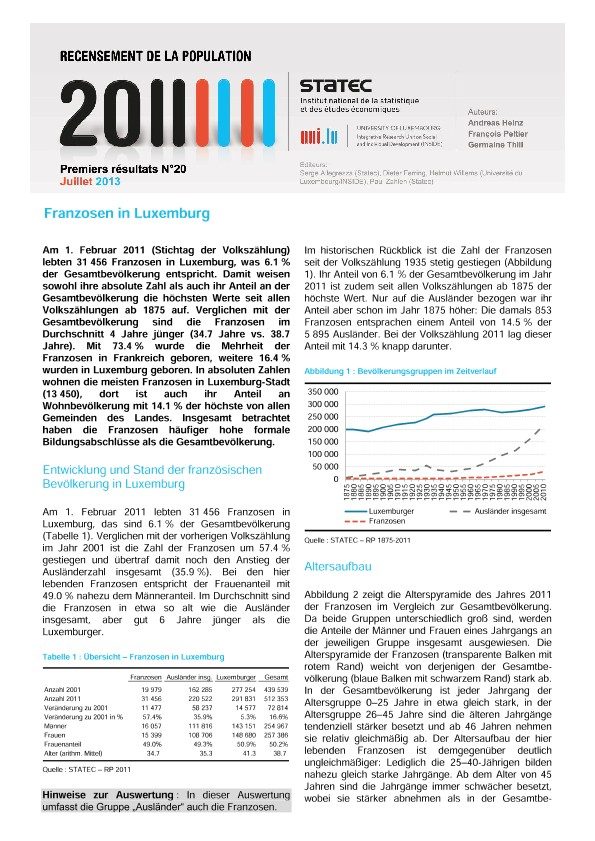
At the time of the census, 31,456 French lived in Luxembourg, or 6.1% of the total population. In absolute terms and as a percentage of the total population, these values are the highest since the census of 1875. The average age of the French living in Luxembourg is, with 34.7 years, lower than that of the total population (38.7 years). Since the 2001 census, the number of French living in Luxembourg increased by 57.4%. This growth exceeds even that of the total of foreigners which has increased by 35.9% since 2001. 72% of French residents in 2011 arrived between 1995 and 2011, while the corresponding figure for this time period is only 56% for all immigrants. 73.4% of the French living in the country were born in France and 16.4% were born in the Grand Duchy. The French are the most numerous in Luxembourg City (13 450 people). Their relative share is also the highest in the capital, with 14.1% of the population of the City of Luxembourg. Overall, the education level of french people living in Luxembourg is higher than that of the total population.
More data (french EXCEL files)
More data (german EXCEL files)
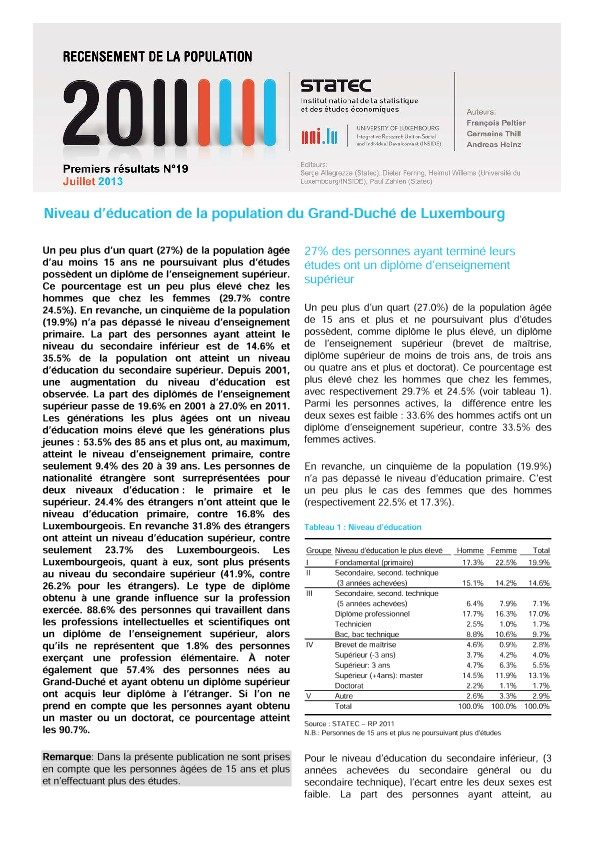
Niveau d’éducation de la population du Grand-Duché de Luxembourg
27% of the population aged 15 years and over and not pursuing studies hold a higher education diploma. This percentage is slightly higher for men than for women (29.7% against 24.5%). However, the level of primary education is not exceeded by 19.9% of the population. The proportion of people who have reached the lower secondary level is 14.6% and 35.5% of the population has reached the level of upper secondary education. Since 2001, a global increase in education levels is observed. The share of tertiary education increased from 19.6% in 2001 to 27.0% in 2011. Elderly cohorts have a lower level of education than younger generations: 53.5% of those aged 85 and over, reached only the level of primary education. For the 20 to 39 years old, this percentage is only 9.4%. Foreigners are overrepresented at two levels of education: primary and tertiary. 24.4% of the foreigners reached only a primary education level, against 16.8% of Luxembourgers. However 31.8% of foreigners have reached a tertiary education level. Only 23.7% of Luxembourgers are in this case. The level of education has a great influence on the kind of professional activities pursued. 88.6% of people working in intellectual and scientific professions have a tertiary education diploma, while they represent only 1.8% of those in elementary occupations. 57.4% of the people born in the Grand Duchy, with a tertiary education level, acquired their degree abroad. If we consider people who have obtained a master or a doctorate, this percentage increases to 90.7%.
More data (french EXCEL files)
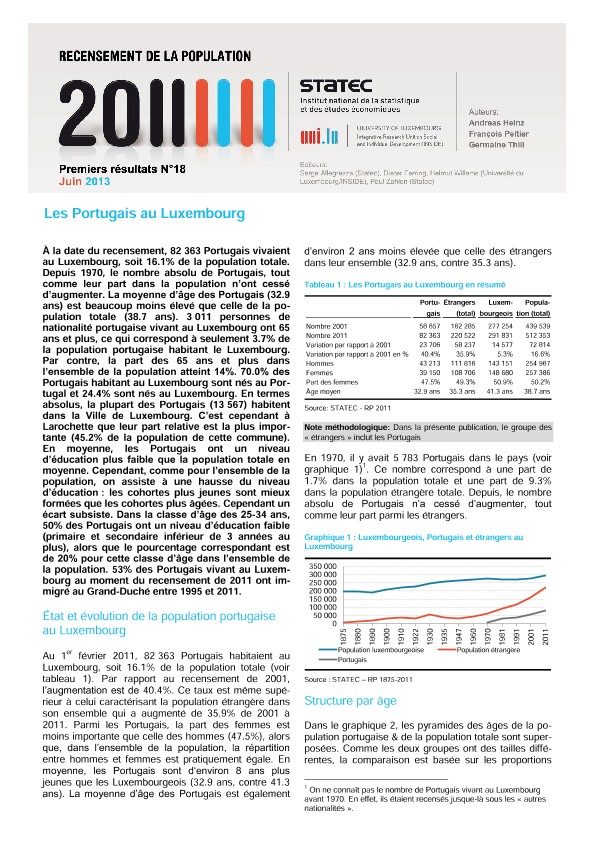
Les Portugais au Luxembourg
At the time of the census, 82 363 Portuguese lived in Luxembourg, who make up 16.1% of the total population. Since 1970, the absolute number of Portuguese, as well as their share in the population increased continuously. The average age of the Portuguese is much lower than the average age of the total population (32.9 years against 38.7 years). 3 011 Portuguese living in Luxembourg are 65 years and older. This corresponds to only 3.7% of the total Portuguese population living in Luxembourg, whereas the proportion of persons aged 65 and over in the total population reached 14%. 70.0% of Portuguese living in Luxembourg were born in Portugal and 24.4% were born in Luxembourg. In absolute terms, most Portuguese (13 567) live in the City of Luxembourg. However, their relative share is the highest in Larochette (45.2% of the population of this municipality). On average, the Portuguese have a lower level of education than the total population. However, as for the total population, the level of education increased: the younger cohorts are better educated than older cohorts. Nevertheless, a gap remains. In the age group of 25 to 34 years, 50% of Portuguese people have a low level of education (primary and lower secondary), while the corresponding percentage is 20% for this age group in the total population. 53% of Portuguese living in the country in 2011 immigrated to Luxembourg between 1995 and 2011.
More data (french EXCEL files)
More data (german EXCEL files)
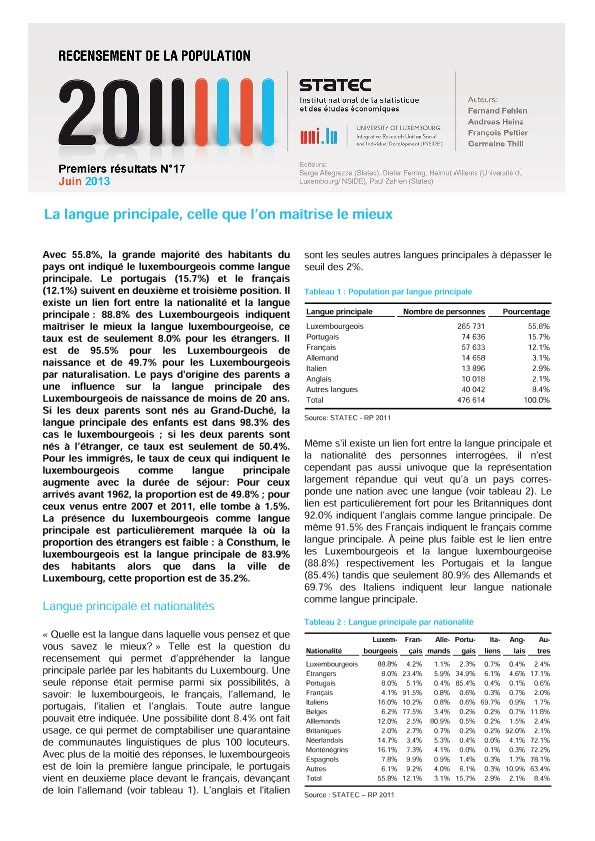
La langue principale, celle que l’on maîtrise le mieux
With 55.8%, the vast majority of residents indicated Luxembourgish as their main language. Portuguese (15.7%) and French (12.1%) follow in second and third position. There is a strong link between nationality and the main language. While 88.8% of Luxembourgers indicate Luxembourgish as the best known language, this rate is only 8.0% for foreigners. 95.5% of native Luxembourgers but only 49.7% of Luxembourgers by naturalization say that Luxembourgish is their main language. The country of origin of the parents affects the main language of the Luxembourg-born children. If both parents are born in the Grand Duchy, for 98.3% of the children who are less than 20 years old the main language is Luxembourgish. If both parents are foreign-born, this rate is only 50.4%. For immigrants, the rate of those who say that Luxembourgish is their main language increases with the length of stay. For those who arrived before 1962, the proportion is 49.8%. For those who came to Luxembourg between 2007 and 2011, it is 1.5%. Luxembourgish as the main language is particularly strong where the proportion of foreigners is low. In Consthum, Luxembourgish is the main language for 83.9% of the population while in the city of Luxembourg, the proportion is 35.2%.
More data (french EXCEL files)
More data (german EXCEL files)
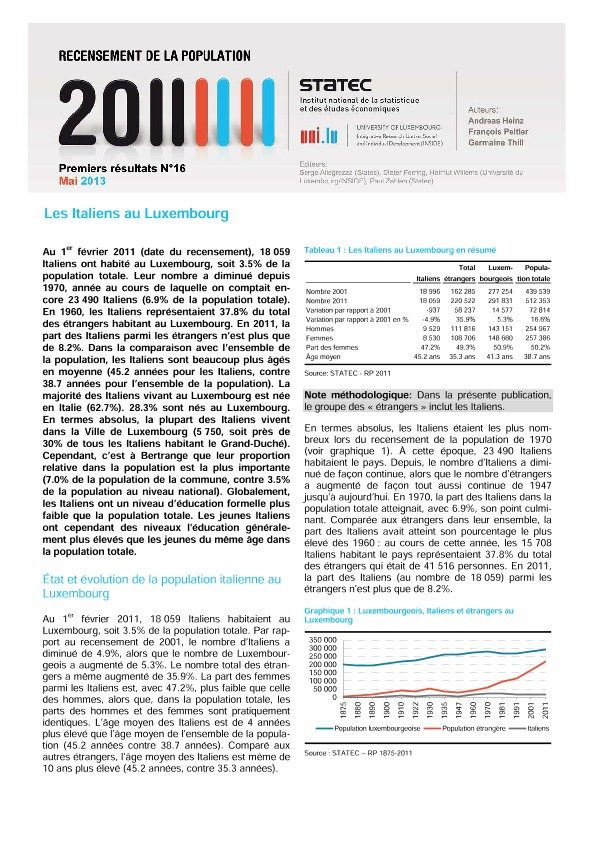
Les Italiens au Luxembourg
On February 1st 2011 (Census Day), 18,059 Italians lived in Luxembourg and made up 3.5% of the total population. Their number has decreased since 1970. In that year 23,490 Italians (6.9% of the total population) are still counted. In 1960, Italians accounted for 37.8% of all foreigners living in Luxembourg. In 2011, the Italians account only for 8.2% of the foreign citizens living in Luxembourg. In comparison with the general population, the Italians are much older on average (45.2 years for Italians, against 38.7 years on average for the total population). The majority of Italians living in Luxembourg was born in Italy (62.7%). 28.3% were born in Luxembourg. In absolute terms, most Italians live in the City of Luxembourg (5 750, nearly 30% of all Italians living in the Grand Duchy). However, their relative proportion in the population is the largest in Bertrange (7.0% of the population of the municipality, against 3.5% at the national level). Overall, the Italians have a lower level of formal education than the total population on average. However, young Italians have more often higher levels of education than people of the same age in the total population.
More data (french EXCEL files)
More data (german EXCEL files)
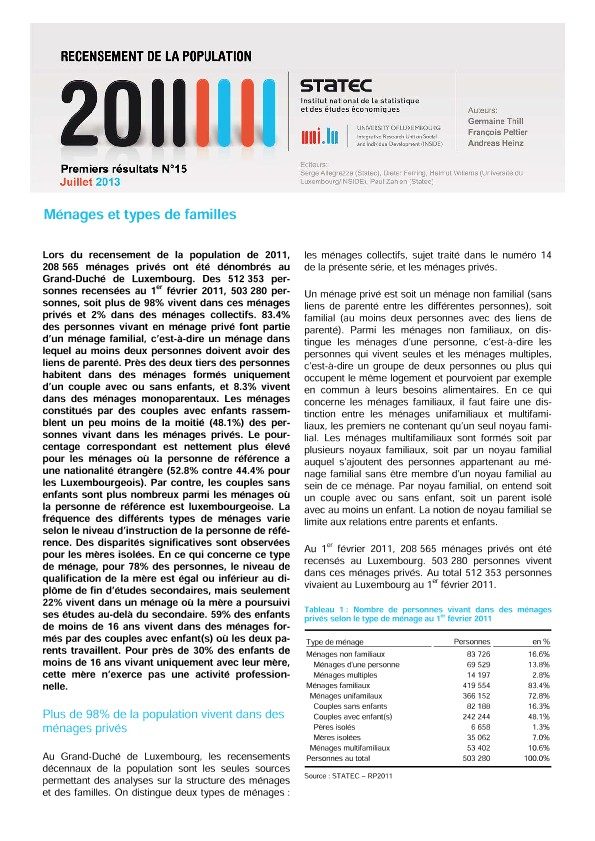
Ménages et types de familles
Of the 512 353 people enumerated on February 1st 2011, 503 280 persons, or more than 98% live in private households and 2% in collective households. 83.4% of people living in private households are part of a family household, that is to say, a household in which at least two persons must be related. Nearly two-thirds of people live in households formed of only one couple with or without children, and 10% live in single-parent households.
More data (actualised version of July 31 2013, EXCEL files)
1.8% de la population vit dans un ménage collectif
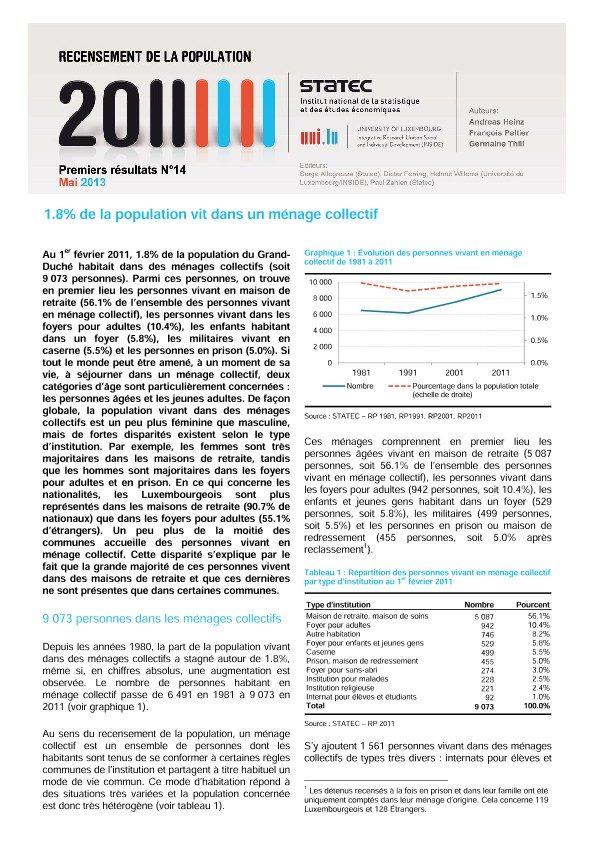
On 1st February 2011, 1.8% of the population of the Grand Duchy were in an institutional household (9073 persons). Among those persons, we find mainly people living in old people’s home (56.1% of collective households), then people living in home for adults (10.4%), children living in home for child (5.8%), military living in barracks (5.5%) and those in prison (5.0%). If everyone may need at a time in his life to stay in a collective household, two age’s categories are particularly relevant: the elderly and young adults. In a global perspective, there are more women than men living in collective households, but disparities exist depending on the type of institution. For example, women are the majority in old people’s home, while men predominate in homes for adults and in prison. As regards nationality, Luxembourgers are more represented in old people’s home (90.7% of national) and less in homes for adults (55.1% of foreigners). Finally, just over half of the municipalities have people living in collective households. This disparity is explained by the fact that the vast majority of these people live in retirement home and this type of institution are present only in some municipalities.
Les langues parlées au travail, à l’école et/ou à la maison
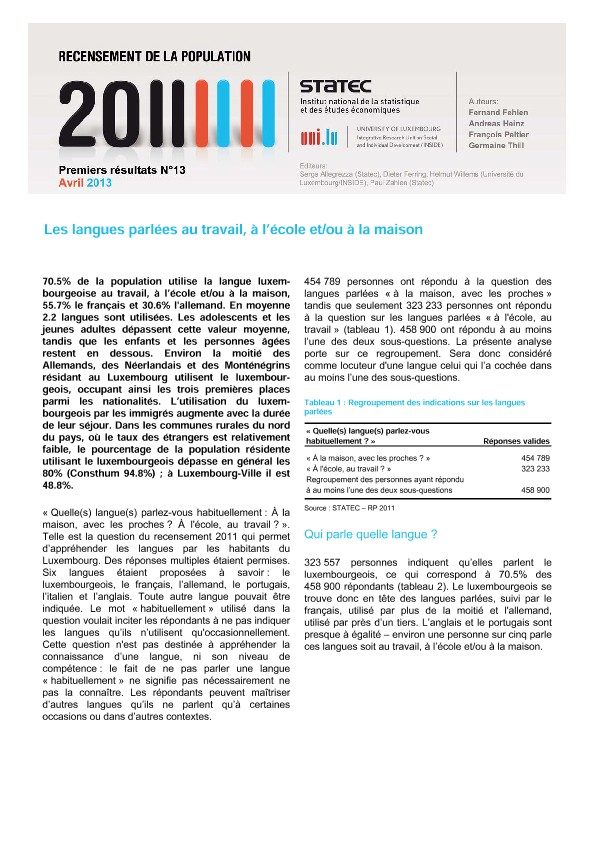
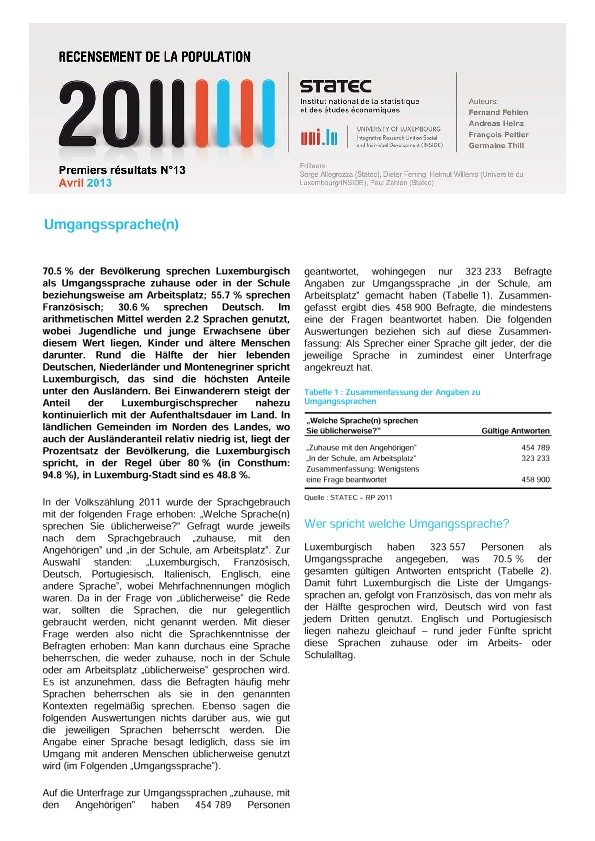
70.5% of the population uses Luxembourgish at work, school and/or at home, 55.7% French and 30.6% German. On average 2.2 languages are used. Adolescents and young adults exceed this average, while children and the elderly are below. About half of the Germans, Dutch and Montenegrins living in Luxembourg use Luxembourgish and occupy the first three places among the foreign nationalities speaking Luxembourgish. The use of Luxembourgish by immigrants increases with the duration of their stay. In rural regions, especially in the north of the country, where the rate of foreigners is relatively low, the percentage of the resident population using Luxembourgish generally exceeds 80% (Consthum 94.8%). In Luxembourg City the rate is only 48.8%.
More data ( EXCEL files)
L’arrière-plan migratoire de la population du Grand-Duché de Luxembourg
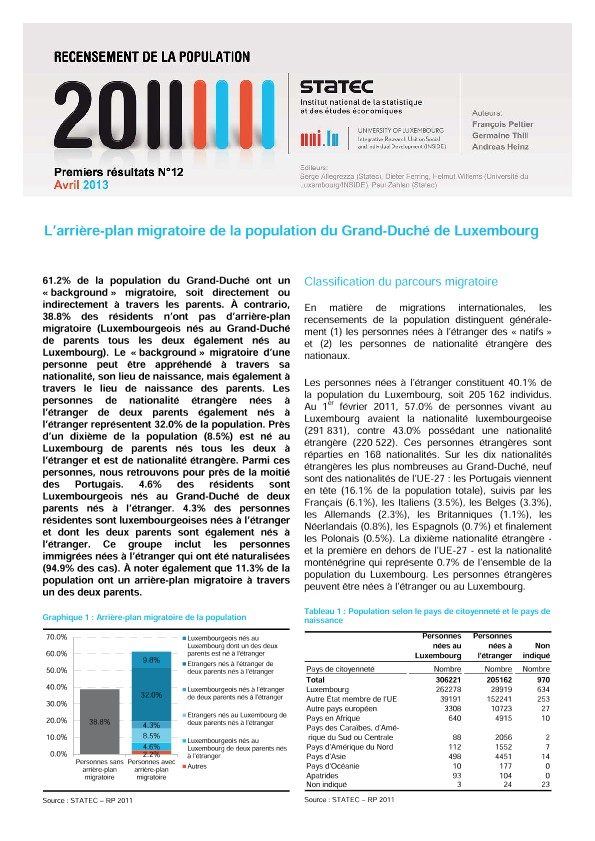
61.2% of the population of Luxembourg has a migration background, directly or indirectly through the parents. In contrast, 38.8% of residents have no migration background (born in Luxembourg with Luxembourgish citizenship and both parents also born in Luxembourg). The migration background of a person can be apprehended through its nationality, its place of birth, but also through the birthplace of parents. Foreigners born abroad (with the two parents also out of Luxembourg) represent 32.0% of the total population. Their average age of arrival in Luxembourg is 26.0 years. Nearly one-tenth of the population (8.5%) was born in Luxembourg with the two parents born abroad and with a foreign nationality. In this group, we find for almost half of them Portuguese. 4.6% of residents were born in Luxembourg with the two parents born abroad. In this group, for almost six out of ten people, the two parents were born either in neighbouring countries of Luxembourg, or in a country where migration to Luxembourg are important (Portugal, Italy, Cape Verde). 4.3% of persons resident in Luxembourg with Luxembourgish citizenship are born abroad with their both parents were also born abroad. This group includes immigrants born abroad who have been naturalized (94.9% of cases). Also note that 11.3% of the population also has a migration background through one of their parents.
More data (EXCEL files)
Immigration et migrations internes
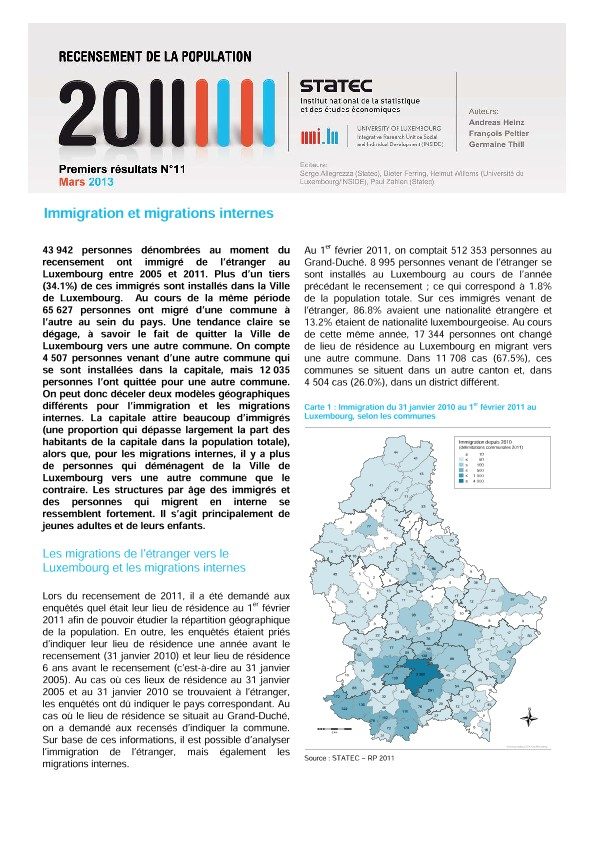
43,942 people counted in the Luxembourg 2011census have immigrated from abroad to Luxembourg between 2005 and 2011. More than a third (34.1%) of these immigrants settled in the City of Luxembourg. During the same period 65,627 people migrated from one municipality to another within the country. A clear trend appears, namely the fact that many people are leaving Luxembourg City for another part of the country, notably the suburbs. There are 4 507 people from another municipality who settled in the capital, but 12,035 people have left for another municipality. Two different geographical models are identified for immigration and internal migration. The capital attracts many immigrants (a proportion that far exceeds the percentage of inhabitants of the capital in the total population), while for internal migration, there are more people moving from Luxembourg City to another municipality. The age structure of immigrants from abroad and people who migrate internally is very similar. It is mainly young adults and their children.
More data (EXCEL files)
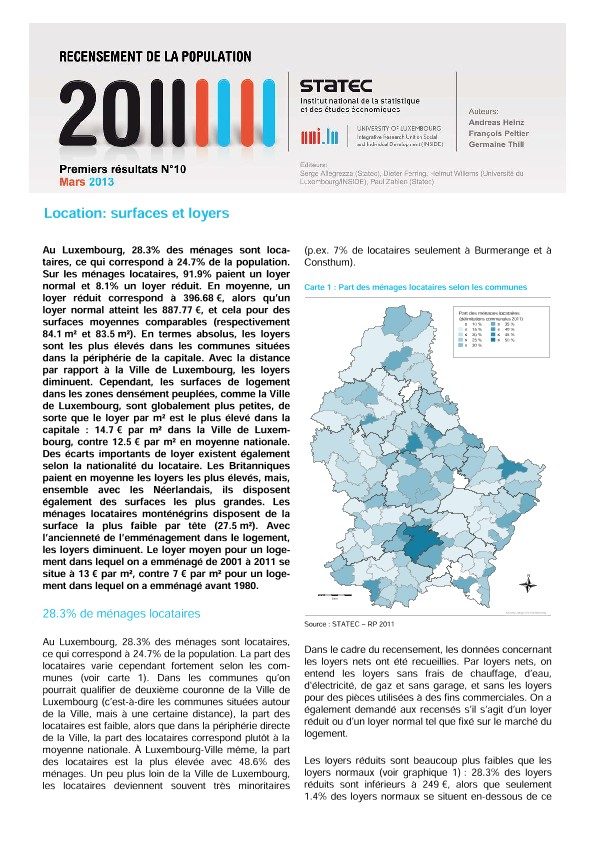
Location: surfaces et loyers
In Luxembourg, 28.3% of households are renters, which corresponds to 24.7% of the population. 91.9% of renter households pay a normal rent and 8.1% a reduced rent. On average, a reduced rent is € 396.7, while a normal rent reaches € 887.8 for similar surfaces (respectively 84.1 m² and 83.5 m²). In absolute terms, the rents are higher in municipalities located in the outskirts of the capital. With the distance from Luxembourg City, rents decrease. However, the housing surfaces in densely populated areas such as the City of Luxembourg, are generally smaller, so that the rent per square meter is the highest in the capital: 14.7 € per m² in the City of Luxembourg, against 12.5 € per m² on national average. Significant differences also exist in rent according to the nationality of the tenant. Britons pay on average the highest rents, but together with the Dutch, they also have larger surfaces. Montenegrins rent the smallest surface area per capita (27.5 m²). The level of rents depends on the time of moving in the dwelling. The average rent for a dwelling in which a household moved from 2001 to 2011 is € 13 per m², against € 7 per m² for a dwelling in which a household moved before 1980.
More data (EXCEL files)
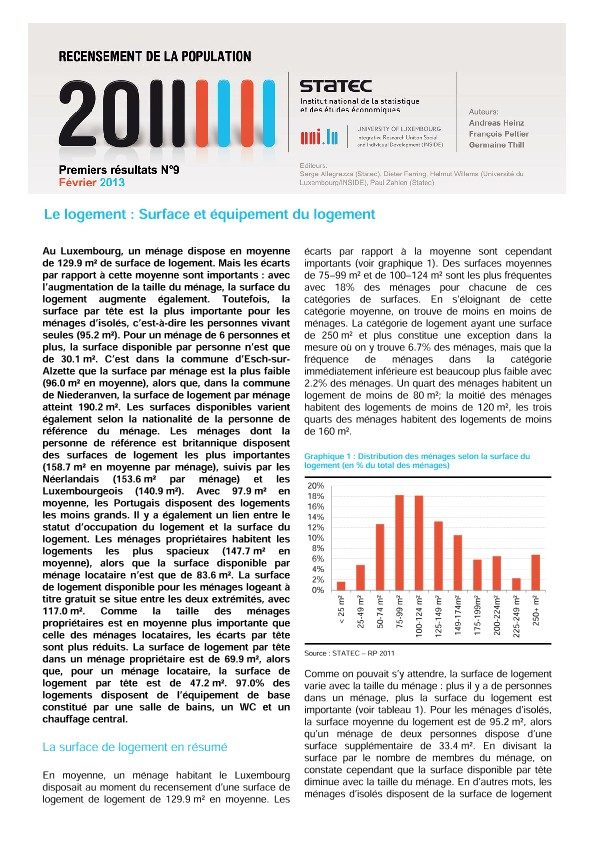
Le logement : Surface et équipement du logement
In Luxembourg, a household has, on average, 129.9 m² surface of dwelling. But deviations from this average are important: with increasing household size, the surface of dwelling also increases. However, the surface per capita is highest for single households, that is to say, people living alone (95.2 m²). For a household of six people or more, the surface available per person is only 30.1 m². It is in Esch-sur-Alzette where the dwelling surface per household is the lowest (96.0 m² on average), while in Niederanven the dwelling surface per household reaches 190.2 m². Dwelling surfaces also vary according to the nationality of the reference person of the household. Households whose reference person is British have the largest dwelling surface (158.7 m² per household on average), followed by the Dutch (153.6 m² per household) and Luxemburgers (140.9 m²). With 97.9 m² per household on average, the Portuguese live in smaller dwellings. There is also a link between the occupancy status and the surface of the dwelling. Owner households live in the most spacious dwellings (147.7 m² on average), while the surface available for tenant households is only 83.6 m². As the household size of owners is on average greater than that of renter households, per capita differences are smaller. The dwelling surface per capita of an owner household is 69.9 m², while for a tenant household, the dwelling surface per capita is 47.2 m². 97.0% of dwellings have a minimum standard of basic equipment, i.e. a bathroom, a toilet and central heating.
More data (EXCEL files)
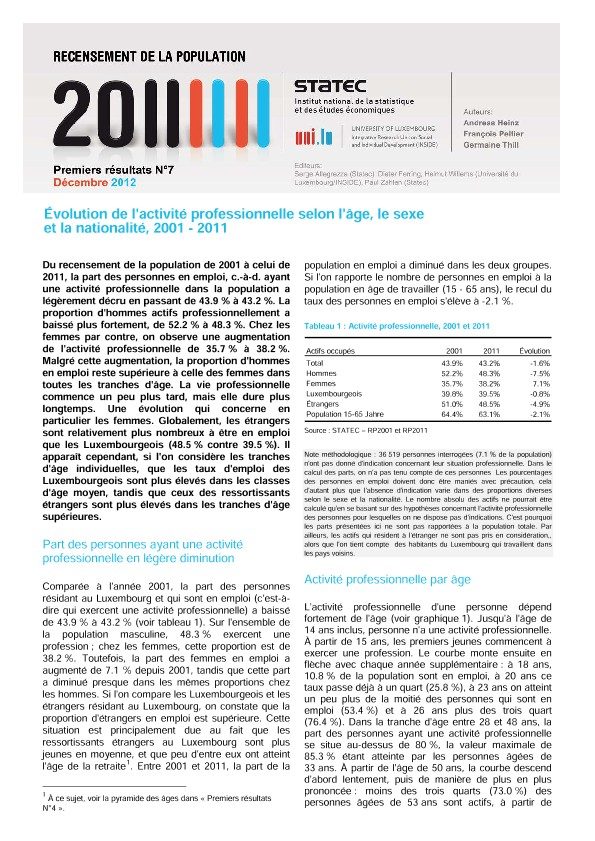
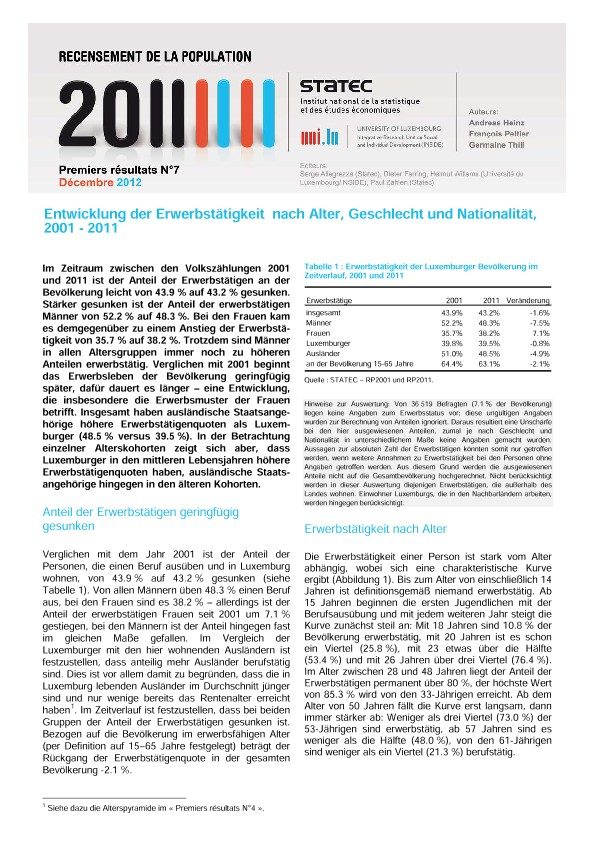
Évolution de l'activité professionnelle selon l'âge, le sexe et la nationalité, 2001 - 2011
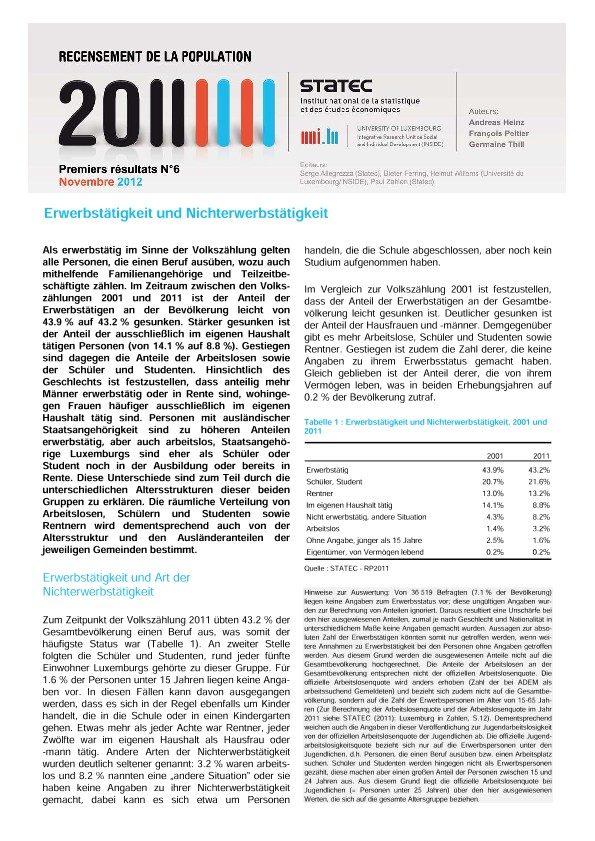
Between the 2001 and the 2011 censuses, the part of the persons in employment in the total population decreased slightly from 43.9 % to 43.2 %. For men this recoil was more important. The percentage of the men in employment passed from 52.2 % to 48.3 % of the total of the male population. The part of the women in employment on the other hand, increased from 35.7 % of the feminine population in 2001 to 38.2 % in 2011. However, in all the age groups, the men remain more numerous to be in employment than the women. The age of the beginning of the professional life increased, but the active life is also longer and this especially for women. The foreigners are relatively more numerous to be in employment (48.5 % of the foreign population) than the Luxembourgers (39.5 % of the Luxembourgish population). In medium age groups, the employment rates of the Luxembourgers are however higher than those of the foreigners. On the other hand, the foreigners are proportionally more numerous to be in employment at more advanced ages than the Luxembourgers.
More data (EXCEL files)
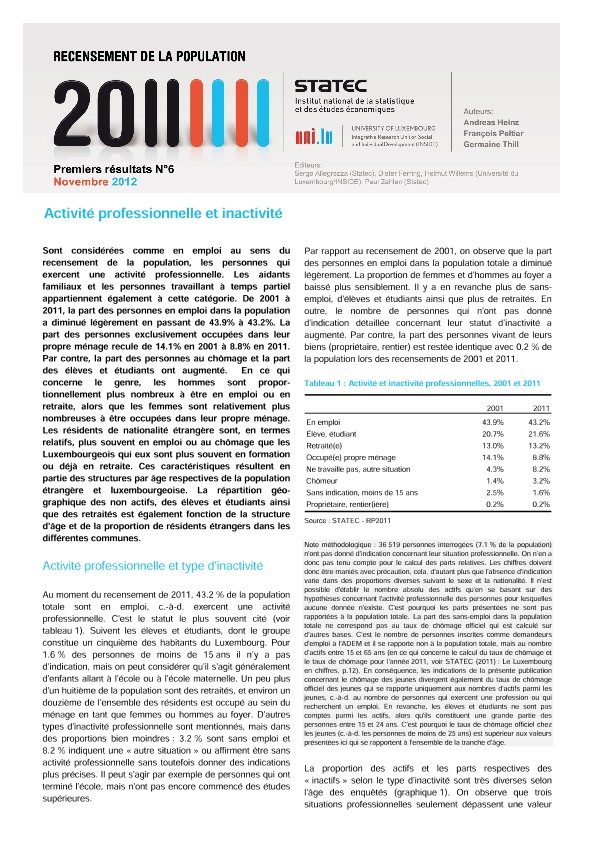
Activité professionnelle et inactivité
Are considered as active in the population census, the residents who perform a professional function. Unpaid family workers and part-time employed persons also belong to this category. From 2001 to 2011, the part of working people in the population decreased slightly from 43.9% to 43.2%. The part of persons exclusively occupied in their own household fell by 14.1% in 2001 to 8.8% in 2011. The part of unemployed persons, pupils and students has increased. Regarding gender, men are more likely to be active or retired, while women are relatively more likely to be occupied in their own household. Residents of foreign nationality are, in relative terms, more often active or unemployed than Luxembourgers who are more often in training or already in pension. These characteristics are partly due to the different age structure of the Luxembourgish and foreign population.
More data (EXCEL files)
N° 04 La population par nationalité (2)
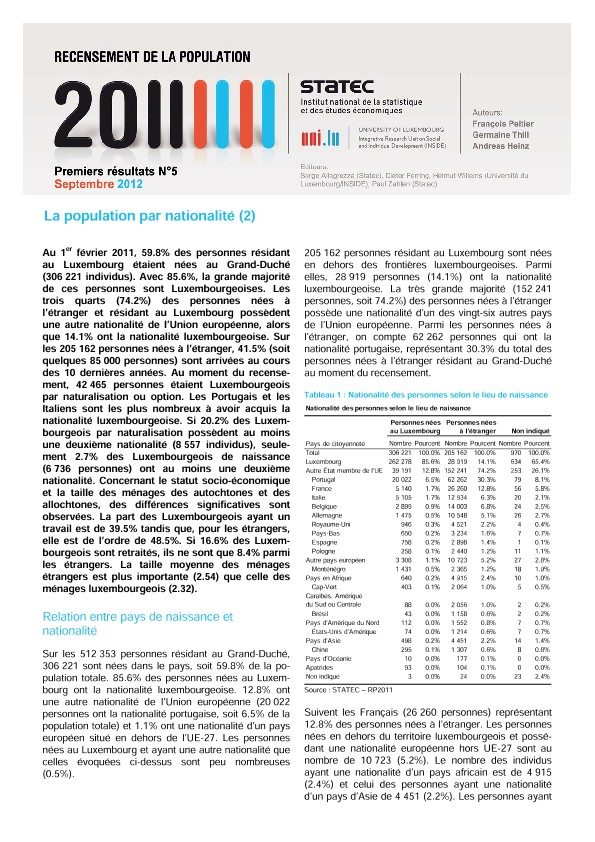
On 1st February 2011, 59.8% of residents were born in Luxembourg (306 221 persons). With 85.6%, the big majority of these people are Luxembourgish. Three-quarters (74.2%) of foreign-born living in Luxembourg have another nationality of the European Union, while 14.1% have the Luxembourgish nationality. 41.5% (+- 85 000 people) of the people born abroad arrived in the past 10 years.
La population par nationalité
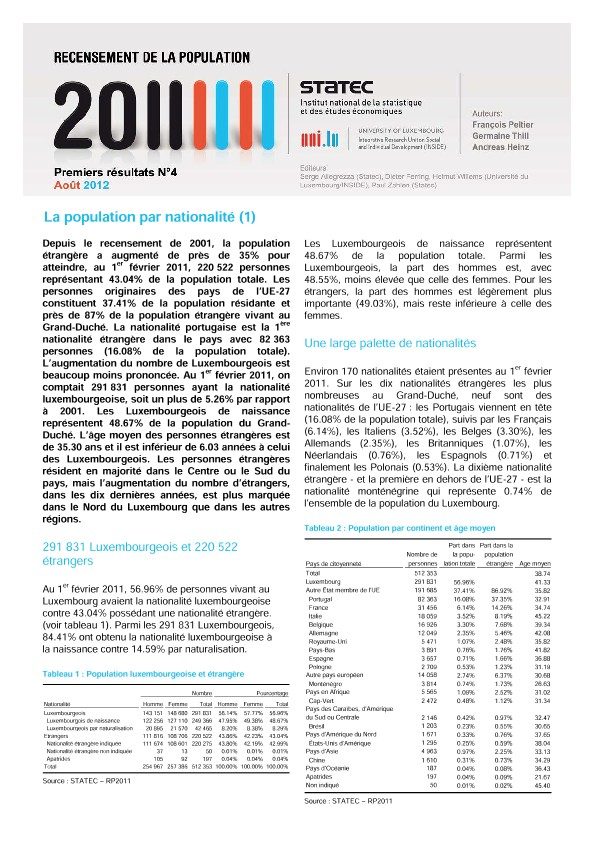
Since the 2001 census, the foreign population has increased by nearly 35%. The 1st February 2011, there were 220 522 foreigners equivalent to 43.04% of the total population. People from the EU-27 countries (except Luxembourg) represent 37.41% of the resident population and nearly 87% of the foreign population living in the Grand Duchy. The Portuguese nationality is the first foreign nationality in the country with 82 363 individuals (16.08% of the total population). The increase of Luxembourgish is much less pronounced. On February 1st 2011, there were 291 831 persons with Luxembourgish nationality, that is to say an increase of 5.26% in comparison to 2001. The native people from Luxembourg constitute 48.67% of the total population. The average age for foreigners in Luxembourg is around 35 years, and is 6 years younger compared to Luxembourgish individuals. Foreign persons live mostly in the Centre or in the South of the country, but the growth of the number of foreigners in the last decade was higher in the Northern area than in other regions.
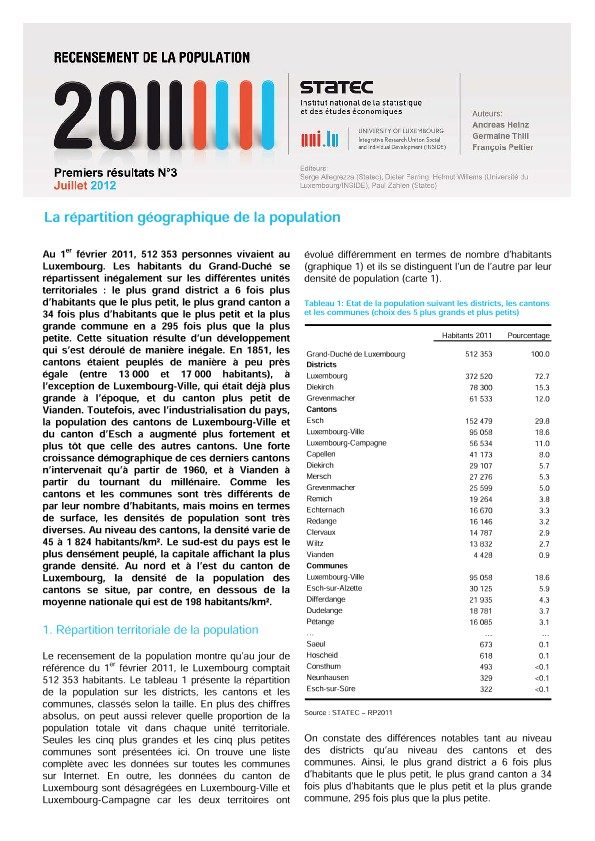
La répartition géographique de la population
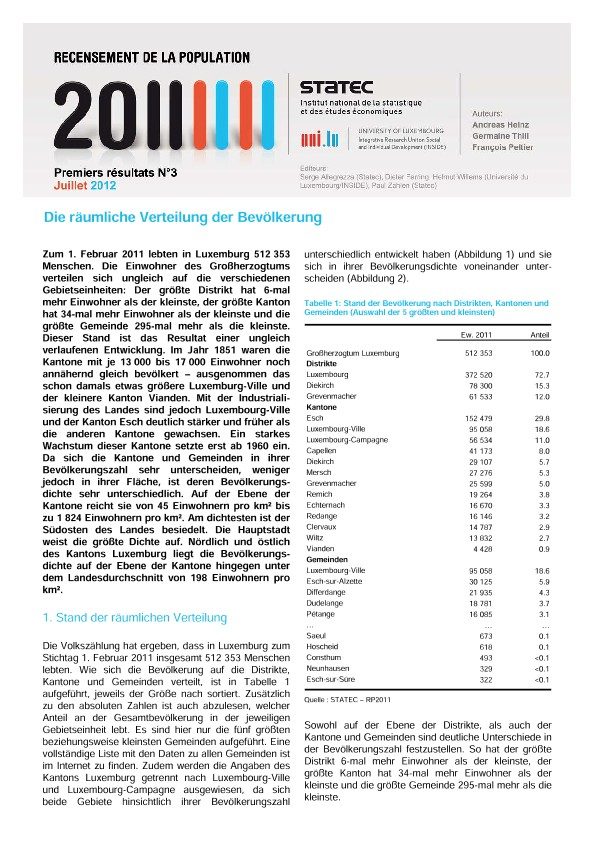
On 1st February 2011, 512 353 persons lived in Luxembourg. The distribution of the population differs widely at the level of the various territorial units: the largest district has six times more inhabitants than the smallest, the largest canton 34 times more than the smallest and the biggest municipality 295 times more than the smallest.
More data (german EXCEL files)
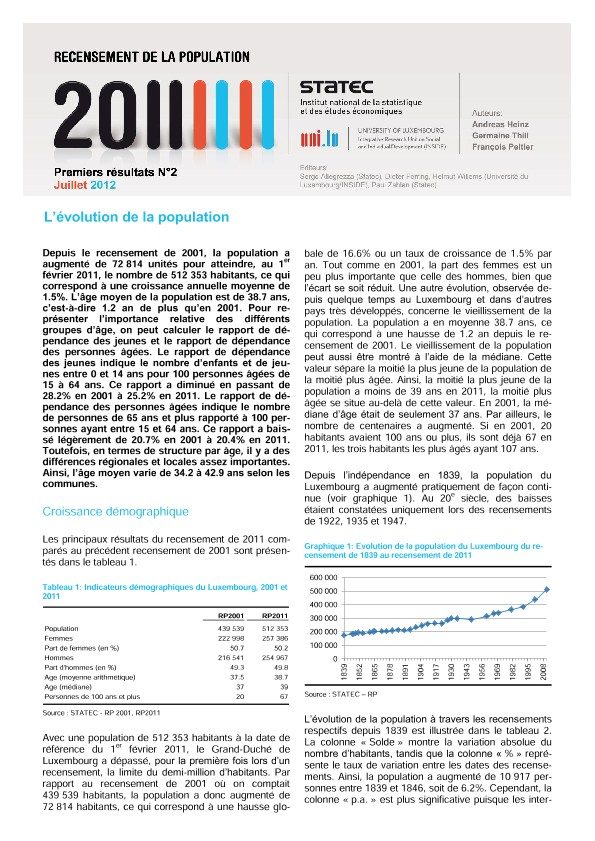
L’évolution de la population
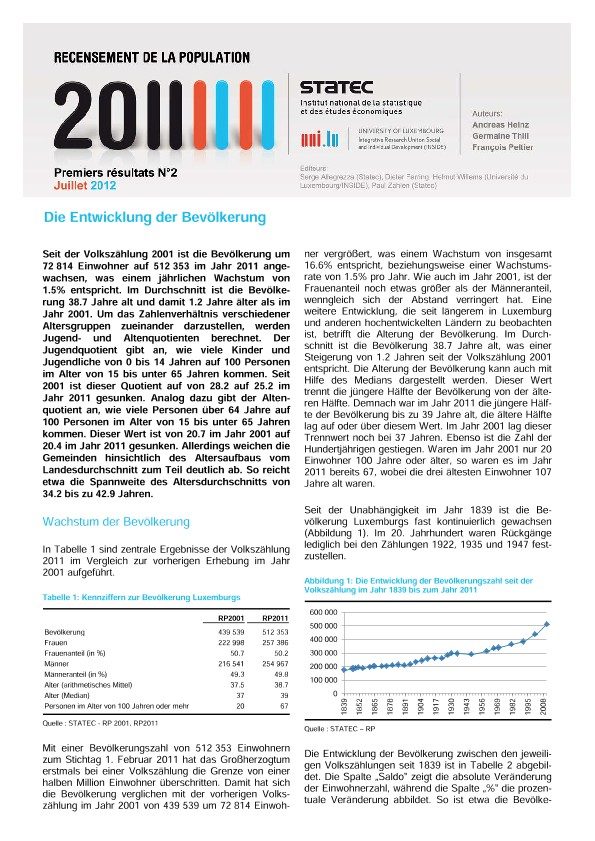
Since the 2001 census, the population increased by 72 814 units to reach the number of 512 353 inhabitants on 1st February 2011. This corresponds to an average annual growth of 1.5%. The average age of the population is 38.7 years, that is to say 1.2 year more than in 2001.
More data (german EXCEL files)
Making of du recensement général de la population au 1er février 2011
This publication is the first in a series, produced jointly by STATEC and the University of Luxembourg / INSIDE (Integrative Research Unit on Social and Individual Development), presenting the results of the 2011 population census. The 36th population census in the Grand Duchy of Luxembourg was held on February 1, 2011.
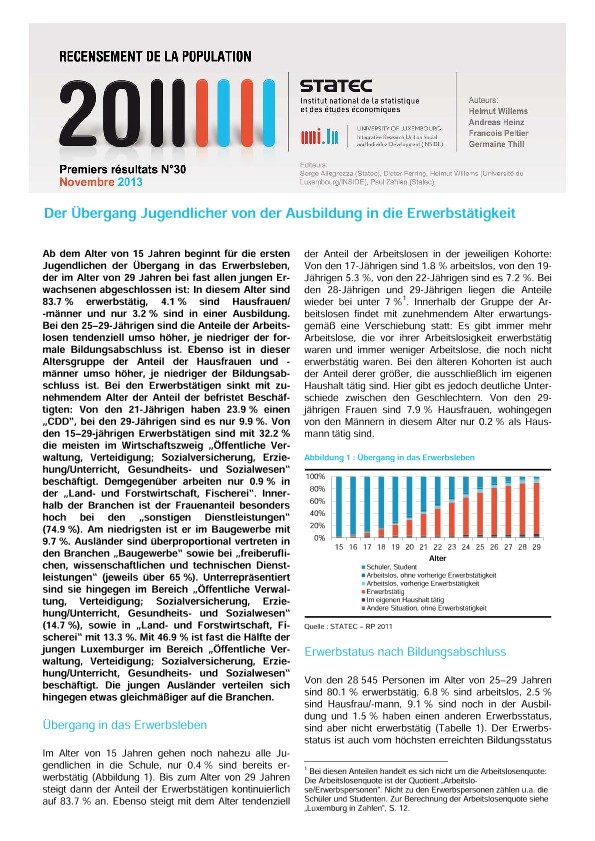
Der Übergang Jugendlicher von der Ausbildung in die Erwerbstätigkeit
The transition of young people from education to the labor market begins at age 15. This transition phase ends at the age of 30 years. At the age of 29, 83.7 % of young adults are employed, 4.1 % work in their own households and only 3.2 % are still in education. Unsurprisingly, in 25-29 age class, the share of unemployed is much higher for people with a low education level. Similarly, in this age group, people with a low education level are working more often in their own household. Among young people who have a job, the share of fixed-term contracts (CDD) decreases with age. For young people aged 21, the share of CDD is 23.9 %. The rate falls to 9.9 % among persons aged 29. 32.2 % of all young people aged 15 to 29 years, and having a job, work in the economic branch of "public administration, education, health and social work". In contrast, the corresponding figure is only 0.9 % in agriculture. The share of the female population aged 15-29 years is important in the branch of "other services" (74.9 %), which includes in particular the activities of households as employers and hence the maids. Women are poorly represented in construction (9.7 %). Foreigners aged 15-29 are overrepresented in the construction branch, but also in the "professional, scientific, technical and administrative activities and support services" (65% in both branches). However, foreigners are underrepresented in the "public administration, education and health and social work" branch (4.7 % of the foreigner aged 15-29 in employment) and in agriculture (13.3 %). Almost half of young people (46.9 %) having the Luxembourg nationality work in the public and broader public sector (public administration, education, health and social work). The distribution of young foreigners on the economic branches is more balanced.
More data (french EXCEL files)
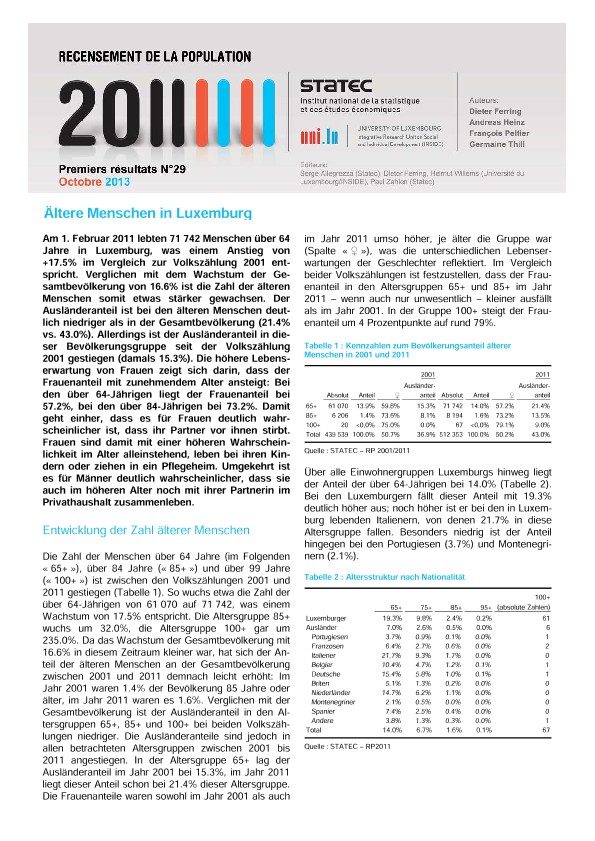
Ältere Menschen in Luxemburg
71,742 people aged 65 and over lived in the Grand Duchy at the census date, an increase of 17.5% compared to 2001. The number of those aged 85 and over rose from 6,206 in 2001 to 8,194 in 2011 (+32%). As the total population has evolved in a quite similar way (+16.6% from 2001 to 2011), the share of the elderly (65 and over) in the total population has remained fairly stable with a slight upward trend: 13.9% in 2001 and 14.0% in 2011. The share of foreigners among the elderly is much lower than their share in the total population: foreigners make up 21.4% of the population aged 65 and over living in Luxembourg, while the percentage of foreigners in the total population reached 43.0%. However, the proportion of foreigners among the elderly aged 65 and over increased: in 2001, they accounted for only 15.3% of this age group (against 21.4% in 2011). The higher life expectancy of women is reflected in the fact that the share of women in the population increases steadily with age. Among all seniors aged 65 and over, the proportion of women is 57.2%. The proportion of women increases to 73.2% among those aged 85 and over. For women, the likelihood that their partner dies is much higher than for men. As a result, older women are more often widowed, live more often with their children and live more frequently than men in a retirement home. In contrast, older males live more frequently with their partner in a private household.
More data (french EXCEL files)
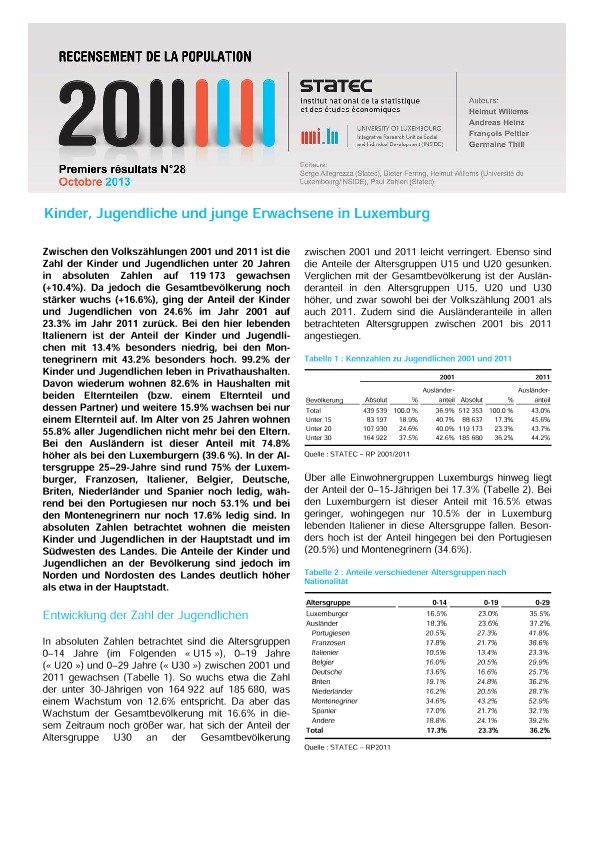
Kinder, Jugendliche und junge Erwachsene in Luxemburg
From 2001 to 2011, the number of children and young people aged under 20 years increased from 107 930 to 119 173 (+10.4%). As the total population has increased more strongly (+16.6% between 2001 and 2011), the share of the less than 20 years in the population has decreased slightly, from 24.6% in 2001 to 23.3% in 2011. For Italians living in Luxembourg, the corresponding percentage is particularly low: 13.4% of Italians are less than 20 years. In contrast, 43.2% of Montenegrins living in Luxembourg are under 20 years. 99.2% of children and young people under 20 years live in private households (as opposed to collective households such as institutions for children and young people). Of those young people living in private households, 82.6% live with both parents, or one parent who himself lives with a partner. 15.9% of those under age 20 live with a single parent. At the age of 25, 55.8% of young people in Luxembourg do not live anymore with their parents. Among foreigners, aged 25, the share of those who no longer live with their parents is higher (74.8%), while for Luxembourgers, the share is lower (39.6%). In the 25-29 years age group, 75% of Luxembourgers are still not living with a partner. This percentage also applies to the French, Italians, Belgians, Germans, British, Dutch and Spaniards. In contrast, only 53.1% of Portuguese and 17.1% of Montenegrins are still singles in the 25-29 years age group. In absolute terms, the majority of children and young live in the capital or in the south-west of the country. In relative terms, the share of children and young people in the population is however higher in the north and north-east of the country.
More data (french EXCEL files)
Deutsche in Luxemburg
12,049 Germans lived in Luxembourg at the census date, or 2.4% of the total population. In absolute terms, the number of Germans increased slightly but steadily since the 1970 census, but their share in the population remained relatively stable since 1947. The average age of the Germans is slightly higher than the average age of the population of the Grand Duchy as a whole (42.1 years against 38.7 years). The vast majority of Germans living in Luxembourg were born in Germany (78.2%), while 12.4% were born in Luxembourg. In absolute terms, the Germans are the most numerous in Luxembourg City (3 546), or 3.7% of the population of the capital. The part of the Germans in the population is, however, the highest in the commune of Grevenmacher, with 7.7% of the population. In general, the Germans have a higher education level than Luxembourgers. The younger cohorts of the Germans in the country have reached a higher education level than the older cohorts.
More data (french EXCEL files)
Die Gemeinden der Région sud
148 812 people lived in the south region of Luxembourg at the time of the census (1 February 2011). This means an increase of 12.3% compared to 2001, which is lower than the national average (+16.6 %). 58.9 % of the residents of the south region are Luxembourgers and 23.1 % are Portuguese. The percentage of the persons of all other nationalities reaches 18 % of the population. With 41.1 %, the global part of the foreigners in the population of the south region is a little lower than the national average (43.0 % of foreigners).The part of home owners is slightly higher in the south region than the national average (76.0 % against 73.0 % for the whole country). The average housing surface is lower in the south region than in the country in general (117 m ², against 130 m ²). 45.5 % of the population of the south region have a low educational level (primary, lower secondary). The corresponding percentage is only 34.5 % on average in the country. On the other hand, the part of the residents of the south region having a high educational level is, with 15.1 %, largely lower than the national average (27.1 %).
More data (french EXCEL files)
Die Gemeinden der Nordstad
22 349 people lived in the municipalities of the Nordstad at the time of the census (1 February 2011) that is 7.2 % more than in 2001.In the four less populated and peripheral municipalities to the communes of Diekirch and Ettelbruck, the population growth exceeds the average of the Nordstad, while the increase of the number of inhabitants in Ettelbruck (6.6 %) and to Diekirch (4.1 %) is lower than the average. Globally, the increase of the population of Nordstad (7.2 %) is situated below the national average (16.6 %). 60.9 % of the inhabitants of the Nordstad are Luxembourgers and 24.1 % are Portuguese. All the other nationalities make up 15.0 % of the inhabitants. As for the educational level, significant differences exist between the Nordstad and the country in general. Less than a third of the inhabitants of the Grand-Duchy have a low educational level (34.5 %), but in the Nordstad this percentage reaches 42.1 %. On the other hand, the part of the residents having a high educational level is only 18.8 % in the Nordstad, against 27.1 % in the total population.
More data (french EXCEL files)
Luxemburg-Stadt : Die Stadtteile
The inhabitants of the capital (95 058 on 1 February 2011) are spread over 24 districts. The district Bonnevoie-Sud is the most populous (11,279 inhabitants), while Pulvermühle has only 333 inhabitants. Between 2001 and 2011, the district of Cents has experienced the highest demographic growth (+72.2%), while Pfaffenthal (-8.7%) and Clausen (-10.8%) lost population. In all parts of the capital, the share of foreigners increased. In the station district (Gare), the proportion of foreigners is the highest (81.6% in 2011). In Cents their share is the lowest with 42.4%. In the neighborhood of the station, the average dwelling size is the smallest (69.5 sqm), that is half of the dwelling size in Cessange (130.0 sqm). Residents of Grund and the station district live overwhelmingly for rent (respectively 71.5% and 74.7% of the population). In contrast, in Cents, the share of tenants is only 19.4%.
More data (french EXCEL files)
More data (german EXCEL files)
Luxemburg-Stadt im Vergleich zum Umland und dem Großherzogtum
95,058 people lived in the capital at the time of the census (1 February 2011). This means an increase of 24.0% compared to 2001. The population growth of the City of Luxembourg has exceeded that of its periphery, that is to say, Luxembourg-Campagne (whose population has increased by 17.0% from 2001 to 2011), but it has also exceeded the demographic growth of the whole country (+16.6%). Luxembourg-City and its periphery accounted together for 29.6% of the inhabitants of the country in 2011, against 28.4% in 2001. Only a third of the residents of the capital are Luxembourgers (35.1%), followed by French citizens (14.3%) and the Portuguese (14.1%). The average housing surface in the City of Luxembourg is 105.5 sqm and is well below the average size of homes in the country (129.9 m²) and in the periphery of the capital (144.8 m² in Luxembourg-Campagne).
More data (french EXCEL files)
More data (german EXCEL files)
Belgier in Luxemburg
At the census date (1 February 2011), 16,926 Belgians were living in Luxembourg, which corresponds to 3.3% of the population. In absolute terms and as a percentage of the population, these values are the highest since the census of 1875. On average, Belgians living in Luxembourg are a little older than the total population (39.3 against 38.7 years). Nearly three-quarters (73.6%) of Belgian citizens living in the Grand Duchy were born in Belgium, 17.2% were born in Luxembourg. In absolute terms, the Belgians are the most numerous in Luxembourg City (3 892), which corresponds to 4.1% of the population of the capital. The proportion of Belgians is higher in the Luxembourg regions lying on the border of Belgium. For example, in the commune of Winseler, the Belgians are 190 out of a total population of 1 064 people (17.9% of the population of this commune). On average, the education level of Belgians is higher than that of the total population. Nearly a third of Belgians (33.1%) had a "master" diploma, compared to only 13.1% of the total population and 9.3% of Luxembourgers.
More data (french EXCEL files)
More data (german EXCEL files)
Franzosen in Luxemburg
At the time of the census, 31,456 French lived in Luxembourg, or 6.1% of the total population. In absolute terms and as a percentage of the total population, these values are the highest since the census of 1875. The average age of the French living in Luxembourg is, with 34.7 years, lower than that of the total population (38.7 years). Since the 2001 census, the number of French living in Luxembourg increased by 57.4%. This growth exceeds even that of the total of foreigners which has increased by 35.9% since 2001. 72% of French residents in 2011 arrived between 1995 and 2011, while the corresponding figure for this time period is only 56% for all immigrants. 73.4% of the French living in the country were born in France and 16.4% were born in the Grand Duchy. The French are the most numerous in Luxembourg City (13 450 people). Their relative share is also the highest in the capital, with 14.1% of the population of the City of Luxembourg. Overall, the education level of french people living in Luxembourg is higher than that of the total population.
More data (french EXCEL files)
More data (german EXCEL files)
Umgangssprache(n)
70.5% of the population uses Luxembourgish at work, school and/or at home, 55.7% French and 30.6% German. On average 2.2 languages are used. Adolescents and young adults exceed this average, while children and the elderly are below. About half of the Germans, Dutch and Montenegrins living in Luxembourg use Luxembourgish and occupy the first three places among the foreign nationalities speaking Luxembourgish. The use of Luxembourgish by immigrants increases with the duration of their stay. In rural regions, especially in the north of the country, where the rate of foreigners is relatively low, the percentage of the resident population using Luxembourgish generally exceeds 80% (Consthum 94.8%). In Luxembourg City the rate is only 48.8%.
More data ( EXCEL files)

Zuwanderung aus dem Ausland und Binnenwanderung
43,942 people counted in the Luxembourg 2011census have immigrated from abroad to Luxembourg between 2005 and 2011. More than a third (34.1%) of these immigrants settled in the City of Luxembourg. During the same period 65,627 people migrated from one municipality to another within the country. A clear trend appears, namely the fact that many people are leaving Luxembourg City for another part of the country, notably the suburbs. There are 4 507 people from another municipality who settled in the capital, but 12,035 people have left for another municipality. Two different geographical models are identified for immigration and internal migration. The capital attracts many immigrants (a proportion that far exceeds the percentage of inhabitants of the capital in the total population), while for internal migration, there are more people moving from Luxembourg City to another municipality. The age structure of immigrants from abroad and people who migrate internally is very similar. It is mainly young adults and their children.
More data (EXCEL files)
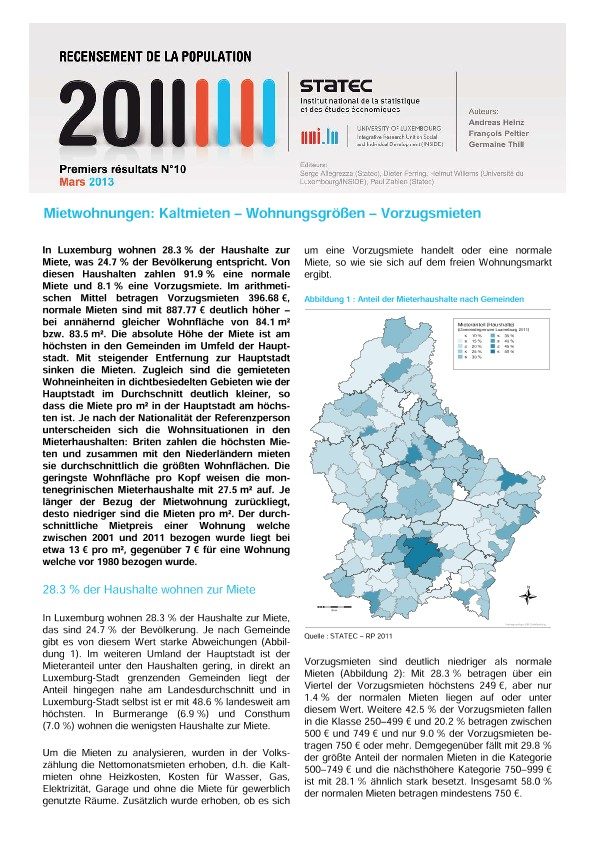
Mietwohnungen: Kaltmieten – Wohnungsgrößen – Vorzugsmieten
In Luxembourg, 28.3% of households are renters, which corresponds to 24.7% of the population. 91.9% of renter households pay a normal rent and 8.1% a reduced rent. On average, a reduced rent is € 396.7, while a normal rent reaches € 887.8 for similar surfaces (respectively 84.1 m² and 83.5 m²). In absolute terms, the rents are higher in municipalities located in the outskirts of the capital. With the distance from Luxembourg City, rents decrease. However, the housing surfaces in densely populated areas such as the City of Luxembourg, are generally smaller, so that the rent per square meter is the highest in the capital: 14.7 € per m² in the City of Luxembourg, against 12.5 € per m² on national average. Significant differences also exist in rent according to the nationality of the tenant. Britons pay on average the highest rents, but together with the Dutch, they also have larger surfaces. Montenegrins rent the smallest surface area per capita (27.5 m²). The level of rents depends on the time of moving in the dwelling. The average rent for a dwelling in which a household moved from 2001 to 2011 is € 13 per m², against € 7 per m² for a dwelling in which a household moved before 1980.
More data (EXCEL files)
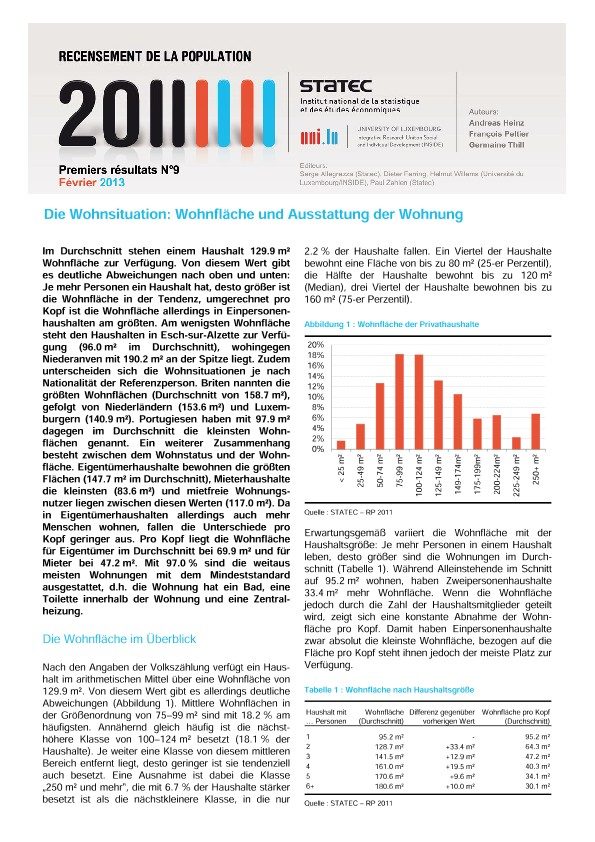
Die Wohnsituation: Wohnfläche und Ausstattung der Wohnung
In Luxembourg, a household has, on average, 129.9 m² surface of dwelling. But deviations from this average are important: with increasing household size, the surface of dwelling also increases. However, the surface per capita is highest for single households, that is to say, people living alone (95.2 m²). For a household of six people or more, the surface available per person is only 30.1 m². It is in Esch-sur-Alzette where the dwelling surface per household is the lowest (96.0 m² on average), while in Niederanven the dwelling surface per household reaches 190.2 m². Dwelling surfaces also vary according to the nationality of the reference person of the household. Households whose reference person is British have the largest dwelling surface (158.7 m² per household on average), followed by the Dutch (153.6 m² per household) and Luxemburgers (140.9 m²). With 97.9 m² per household on average, the Portuguese live in smaller dwellings. There is also a link between the occupancy status and the surface of the dwelling. Owner households live in the most spacious dwellings (147.7 m² on average), while the surface available for tenant households is only 83.6 m². As the household size of owners is on average greater than that of renter households, per capita differences are smaller. The dwelling surface per capita of an owner household is 69.9 m², while for a tenant household, the dwelling surface per capita is 47.2 m². 97.0% of dwellings have a minimum standard of basic equipment, i.e. a bathroom, a toilet and central heating.
More data (EXCEL files)
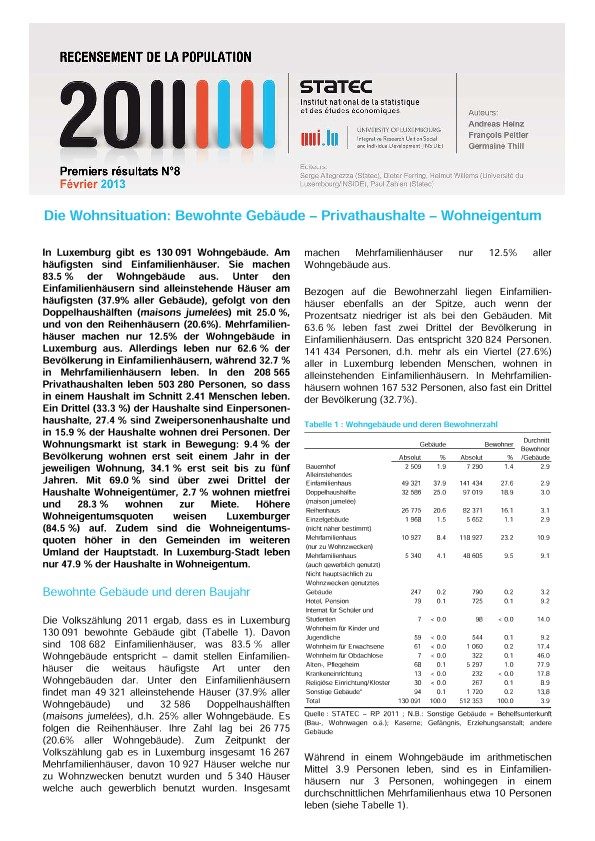
La situation du logement: immeubles d’habitation, ménages, propriétaires et locataires
In Luxembourg, there were 130,091 residential buildings at the time of the census. Single family homes are the prevalent type of buildings. They represent 83.5% of all residential buildings. Of the single family homes, detached houses are predominant (37.9% of all residential buildings), followed by single family semi-detached houses (25.0%) and single-family homes in a row (20.6%). Apartment buildings represent only 12.5% of total residential buildings. However, the share of the population living in single family homes is only 62.6%, while 32.7% of the population is living in apartment buildings. In the 208,565 private households, there are 503,280 people, that is to say, on average, 2.41 persons per household. One third of households (33.3%) are single households. 27.4% of residents live in two-person households and 15.9% in households of three people. The real estate market is moving. 9.4% of people surveyed in Luxembourg live less than one year in their home. 34.1% live in their homes for less than 5 years. More than two thirds of households (69.0%) are homeowners, 28.3% of households live in rental and 2.7% live in homes without paying rent. The percentage varies widely by nationality, but also by municipalities. 84.5% of Luxembourgers are homeowners. The percentage of owners is generally higher in municipalities located at a certain distance from the center. In Luxembourg-City, only 47.9% are homeowners.
More data (german EXCEL files)
Evolution de l'activité professionnelle selon l'âge, le genre et la nationalité, 2001 - 2011
Between the 2001 and the 2011 censuses, the part of the persons in employment in the total population decreased slightly from 43.9 % to 43.2 %. For men this recoil was more important. The percentage of the men in employment passed from 52.2 % to 48.3 % of the total of the male population. The part of the women in employment on the other hand, increased from 35.7 % of the feminine population in 2001 to 38.2 % in 2011. However, in all the age groups, the men remain more numerous to be in employment than the women. The age of the beginning of the professional life increased, but the active life is also longer and this especially for women. The foreigners are relatively more numerous to be in employment (48.5 % of the foreign population) than the Luxembourgers (39.5 % of the Luxembourgish population). In medium age groups, the employment rates of the Luxembourgers are however higher than those of the foreigners. On the other hand, the foreigners are proportionally more numerous to be in employment at more advanced ages than the Luxembourgers.
More data (EXCEL files)
Statut d'activité des résidents du Luxembourg
Are considered as active in the population census, the residents who perform a professional function. Unpaid family workers and part-time employed persons also belong to this category. From 2001 to 2011, the part of working people in the population decreased slightly from 43.9% to 43.2%. The part of persons exclusively occupied in their own household fell by 14.1% in 2001 to 8.8% in 2011. The part of unemployed persons, pupils and students has increased. Regarding gender, men are more likely to be active or retired, while women are relatively more likely to be occupied in their own household. Residents of foreign nationality are, in relative terms, more often active or unemployed than Luxembourgers who are more often in training or already in pension. These characteristics are partly due to the different age structure of the Luxembourgish and foreign population.
More data (EXCEL files)
Die räumliche Verteilung der Bevölkerung
On 1st February 2011, 512 353 persons lived in Luxembourg. The distribution of the population differs widely at the level of the various territorial units: the largest district has six times more inhabitants than the smallest, the largest canton 34 times more than the smallest and the biggest municipality 295 times more than the smallest.
More data (german EXCEL files)
Die Entwicklung der Bevölkerung
Since the 2001 census, the population increased by 72 814 units to reach the number of 512 353 inhabitants on 1st February 2011. This corresponds to an average annual growth of 1.5%. The average age of the population is 38.7 years, that is to say 1.2 year more than in 2001.
More data (german EXCEL files)